About telemetry and reporting
With Replicated, you get out-of-the-box visibility into your application instances running in customer-controlled environments. For example:
- Metadata about the environment where the application is running, such as the Kubernetes distribution, version, or cloud provider
- Application uptime and service status
- Adoption data such as the current application version
Replicated also supports collecting custom metrics through the Replicated SDK for reporting on usage data such as daily or weekly active users.
Unlike traditional observability with its firehose of logs, Replicated reporting focuses on application usage and functionality at a customer level.
Access to reporting data empowers vendors to take more informed action:
- Feature prioritization: Low feature usage can indicate the need to invest in usability, discoverability, or documentation.
- Security scoping: Knowing which version each customer is running helps you scope and prioritize CVE disclosures and patches.
- Churn and growth signals: Decreased usage for a customer can indicate churn risk, while increased usage can indicate expansion opportunities.
- Performance monitoring: Uptime data helps troubleshoot issues and understand the resiliency of your software.
Custom metrics with the SDK
In addition to built-in insights like uptime and time to install, you can configure custom metrics to measure application instances in customer environments. Collect custom metrics from instances in both online and air gap environments.
The following diagram demonstrates how a custom activeUsers metric is sent to the in-cluster API and displayed in the Vendor Portal:
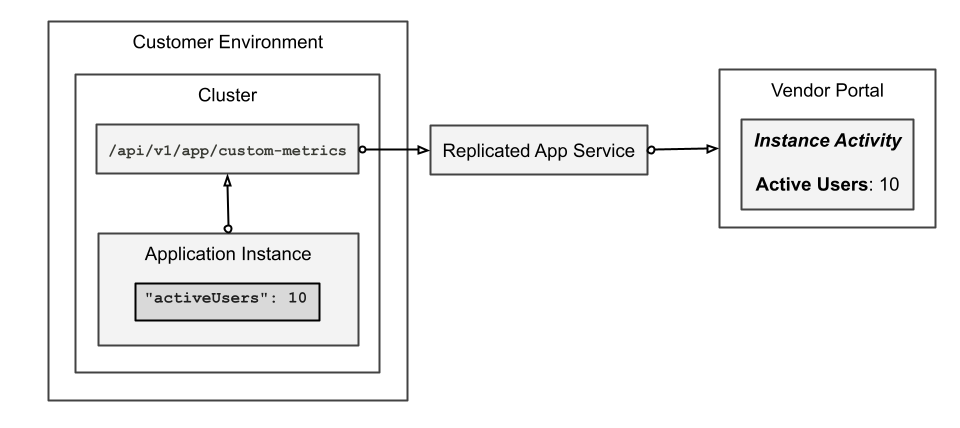
View a larger version of this image
For more information, see Configure Custom Metrics.
Air gap telemetry
Air gap instances run in environments without outbound internet access, so they cannot send telemetry to the Vendor Portal directly. Instead, the Replicated SDK collects and stores instance telemetry, including custom metrics, in a Kubernetes Secret in the customer environment.
When a customer generates a support bundle, the stored telemetry is included automatically. When the bundle is uploaded to the Vendor Portal, the telemetry is associated with the correct customer and instance, and the Vendor Portal updates insights and event data accordingly.
Replicated recommends collecting support bundles from air gap customers regularly (monthly or quarterly) to maintain complete telemetry data. The Vendor Portal handles overlapping event archives idempotently.
For more information, see Collect Telemetry for Air Gap Instances.
Event notifications
Define and subscribe to notifications in the Vendor Portal to receive alerts when specific events occur. Built-in event types and filters let you target the events that matter most. For example:
- Customer Success Managers could get an email when a key customer uploads a support bundle
- Support Engineers could get a Slack notification when a customer instance has been unhealthy for an extended period
The following shows an example of the notifications Overview page:
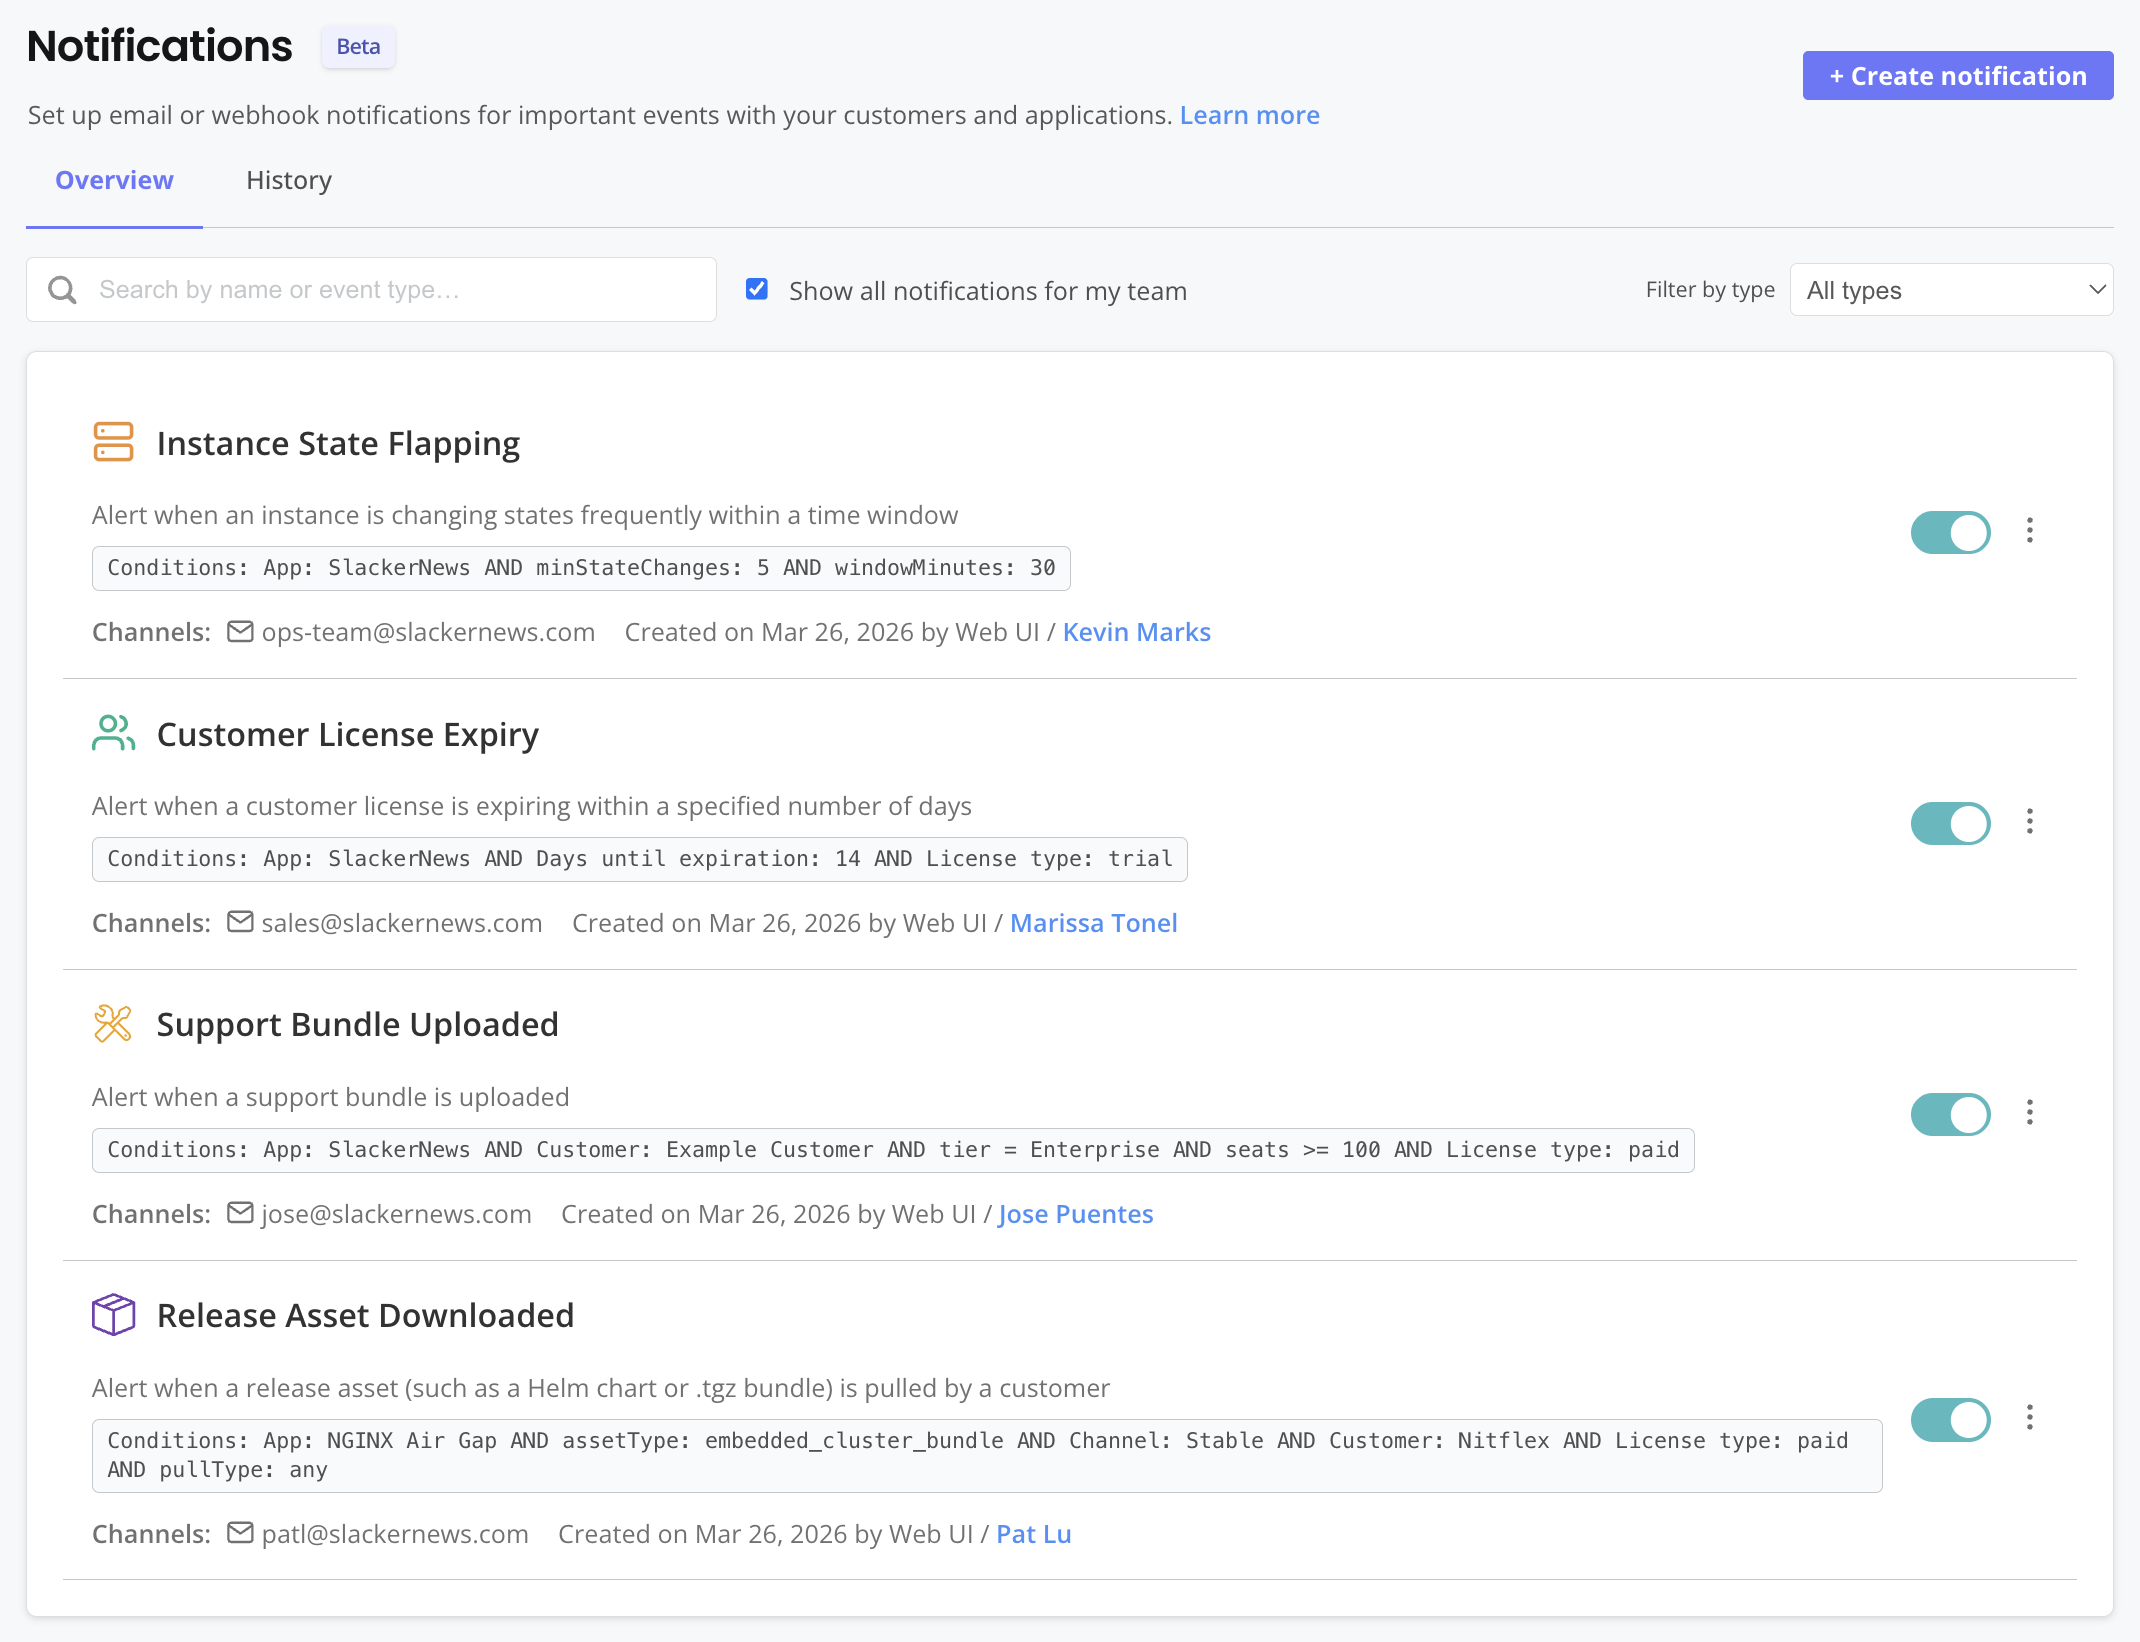
View a larger version of this image
For more information, see Configure Event Notifications.