Adoption Report
This topic describes the insights in the Adoption section on the Replicated Vendor Portal Dashboard page.
About Adoption Rate
The Adoption section on the Dashboard provides insights about the rate at which your customers upgrade their instances and adopt the latest versions of your application. As an application vendor, you can use these adoption rate metrics to learn if your customers are completing upgrades regularly, which is a key indicator of the discoverability and ease of application upgrades.
The Vendor Portal generates adoption rate data from all your customer's application instances that have checked-in during the selected time period. For more information about instance check-ins, see How the Vendor Portal Collects Instance Data in About Instance and Event Data.
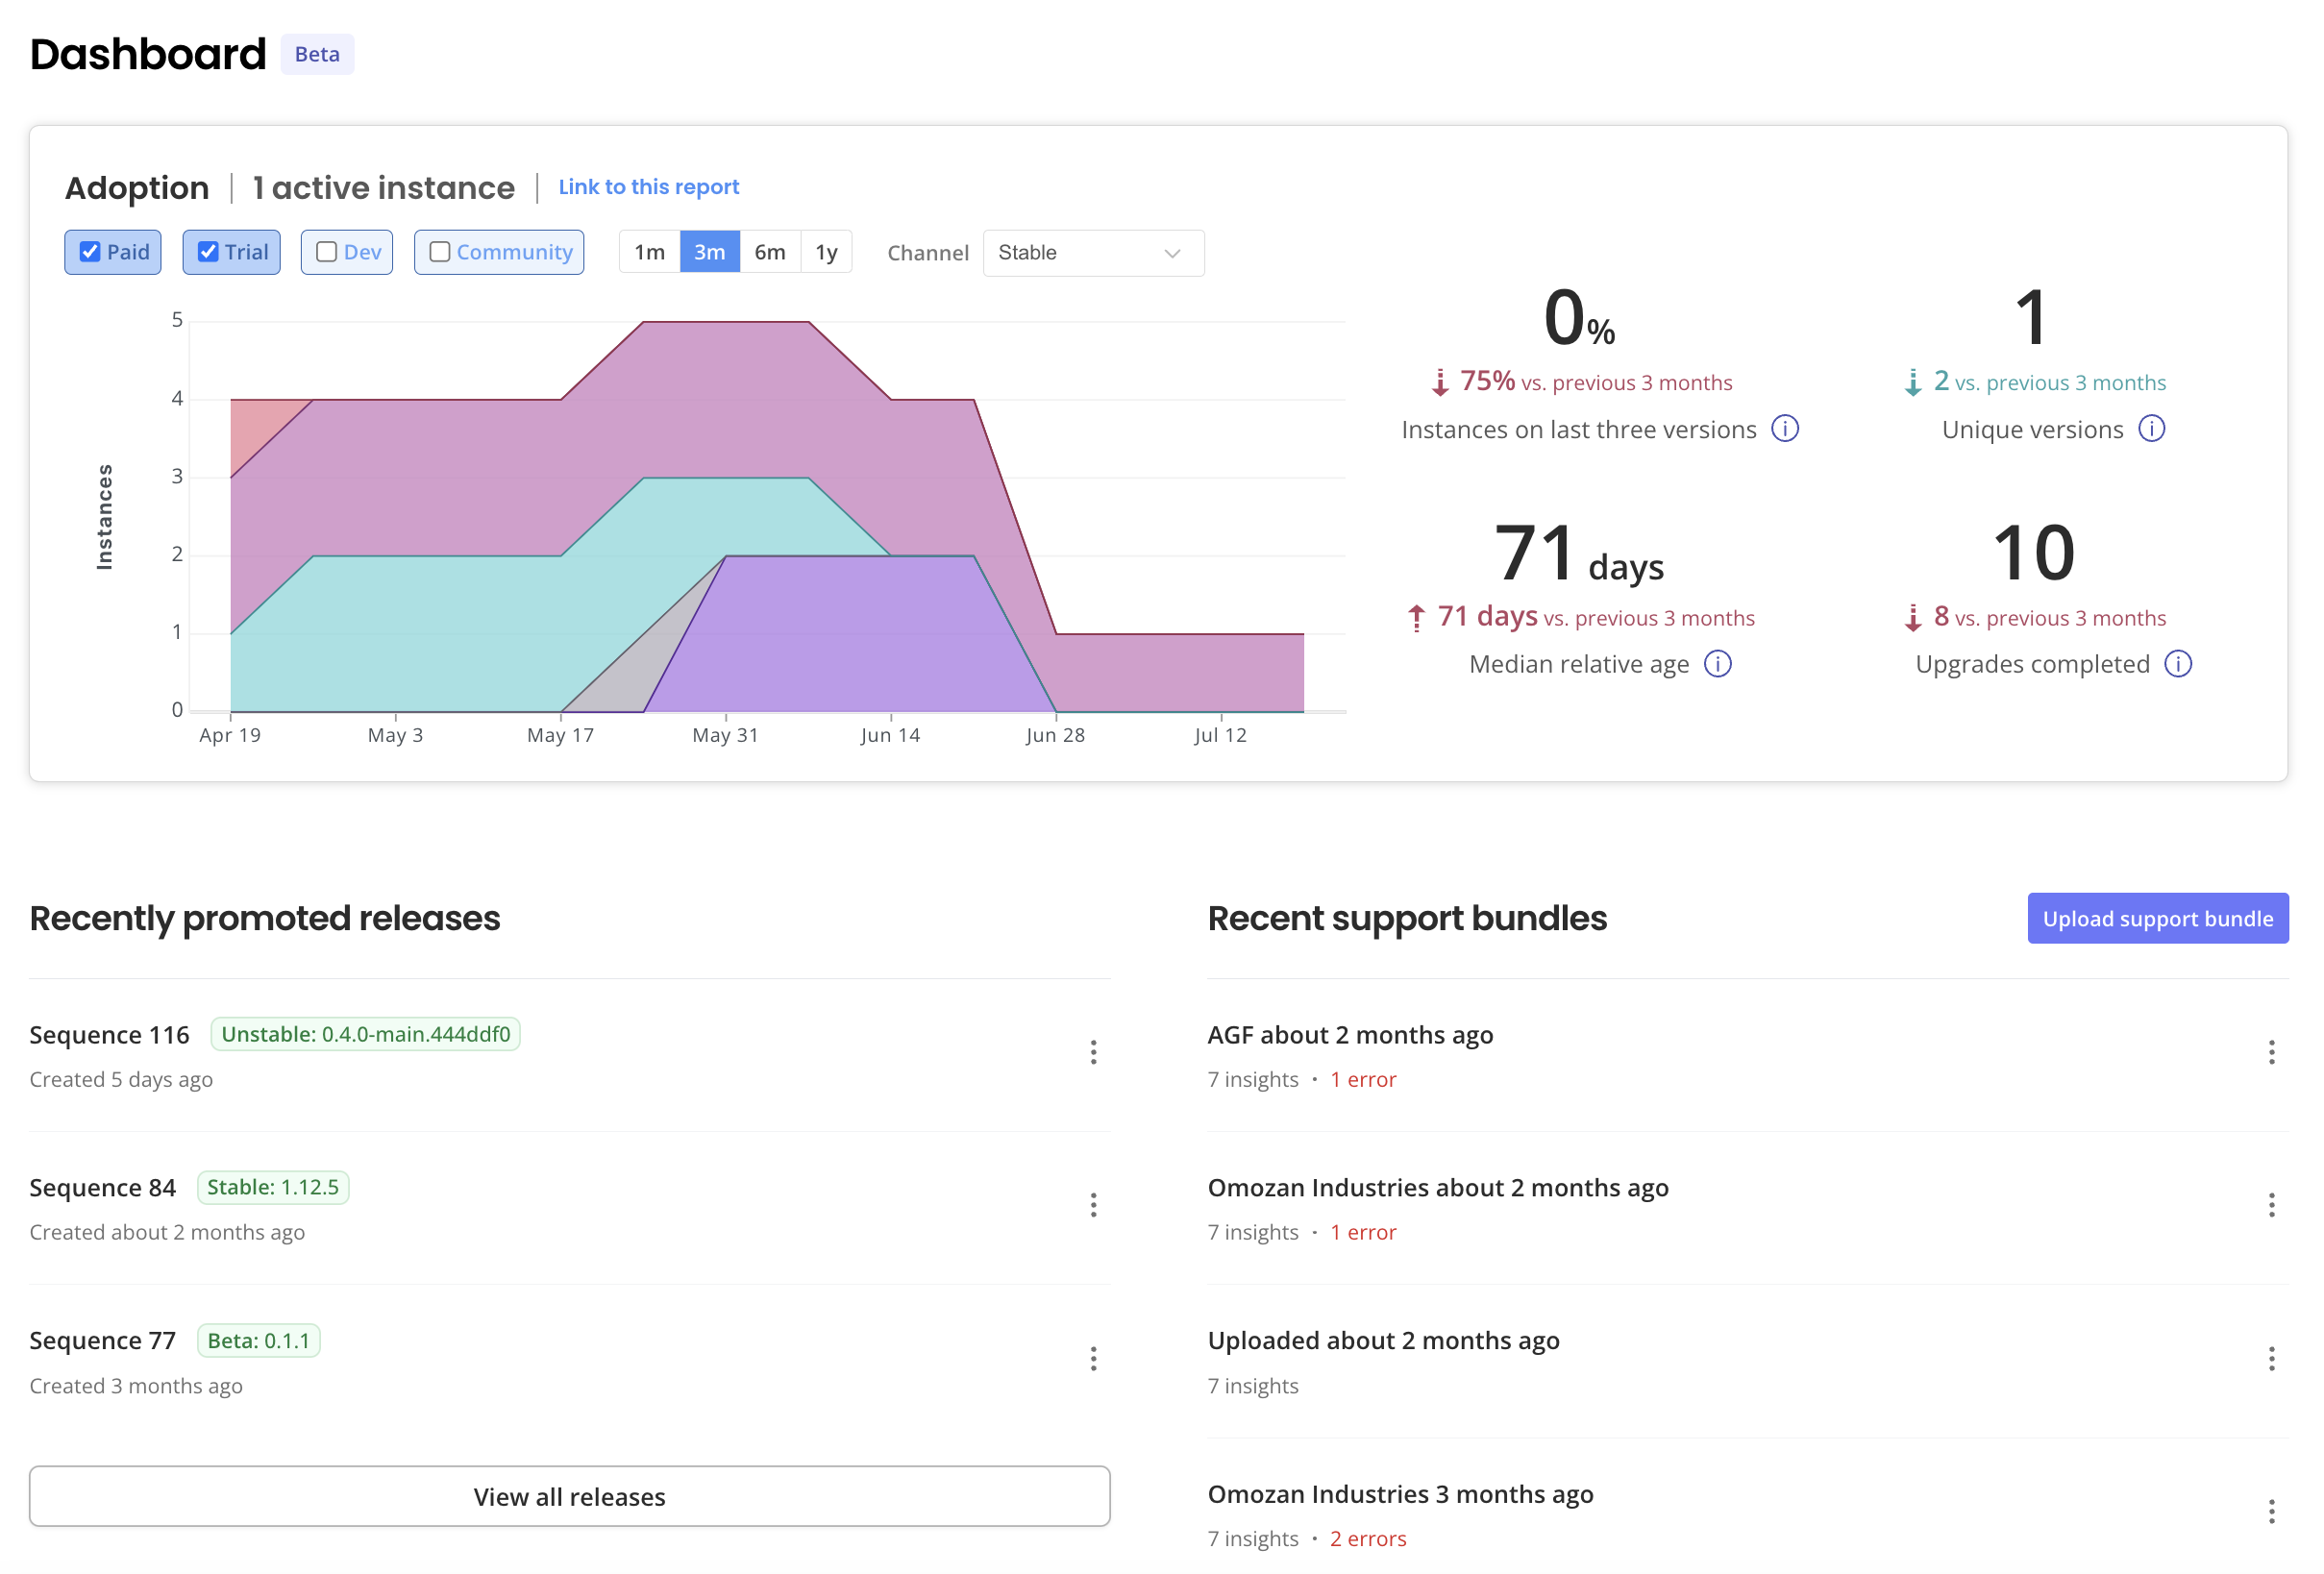
The following screenshot shows an example of the Adoption section on the Dashboard:

View a larger version of this image
As shown in the screenshot above, the Adoption report includes a graph and key adoption rate metrics. For more information about how to interpret this data, see Adoption Graph and Adoption Metrics below.
The Adoption report also displays the number of customers assigned to the selected channel and a link to the report that you can share with other members of your team.
You can filter the graph and metrics in the Adoption report by:
- License type (Paid, Trial, Dev, or Community)
- Time period (the previous month, three months, six months, or twelve months)
- Release channel to which instance licenses are assigned, such as Stable or Beta
Adoption Graph
The Adoption report includes a graph that shows the percent of active instances that are running different versions of your application within the selected time period.
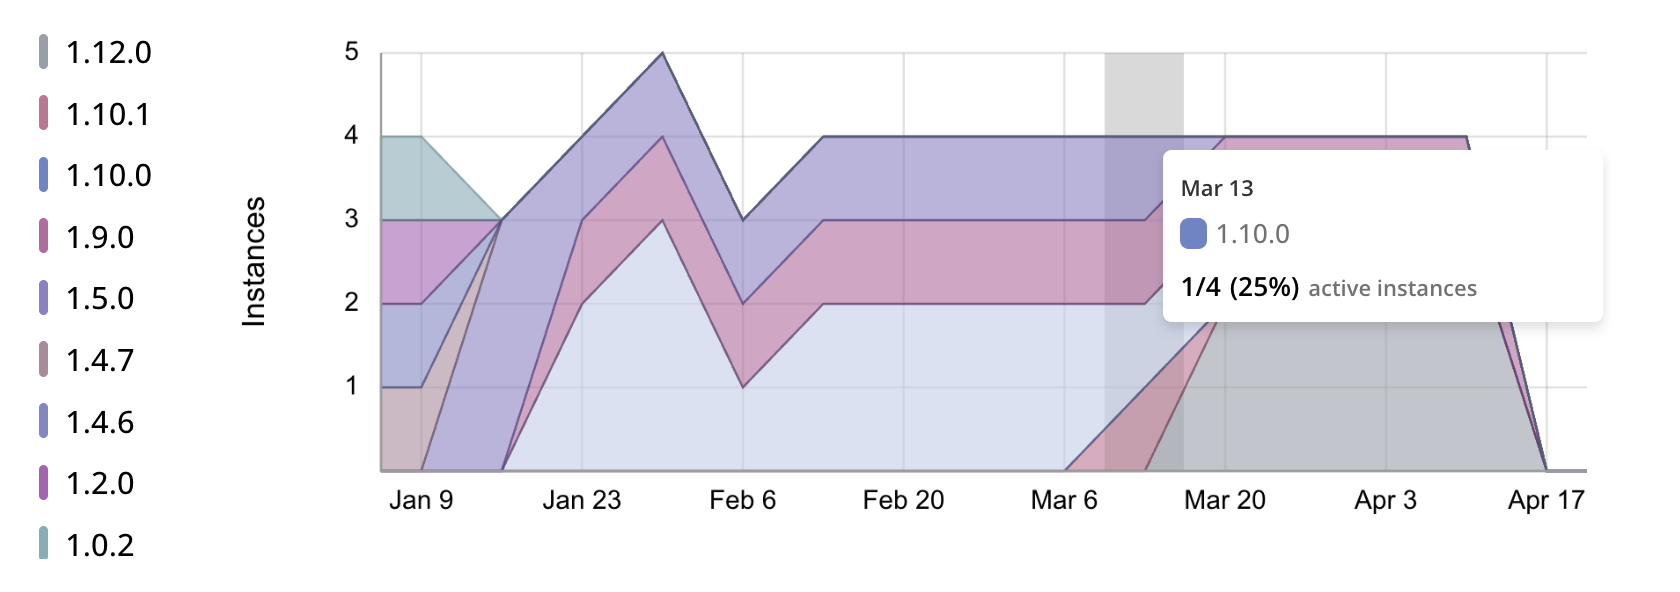
The following shows an example of an adoption rate graph with three months of data:

View a larger version of this image
As shown in the image above, the graph plots the number of active instances in each week in the selected time period, grouped by the version each instance is running. The key to the left of the graph shows the unique color that is assigned to each application version. You can use this color-coding to see at a glance the percent of active instances that were running different versions of your application across the selected time period.
Newer versions will enter at the bottom of the area chart, with older versions shown higher up.
You can also hover over a color-coded section in the graph to view the number and percentage of active instances that were running the version in a given period.
If there are no active instances of your application, then the adoption rate graph displays a "No Instances" message.
Adoption Metrics
The Adoption section includes metrics that show how frequently your customers discover and complete upgrades to new versions of your application. It is important that your users adopt new versions of your application so that they have access to the latest features and bug fixes. Additionally, when most of your users are on the latest versions, you can also reduce the number of versions for which you provide support and maintain documentation.
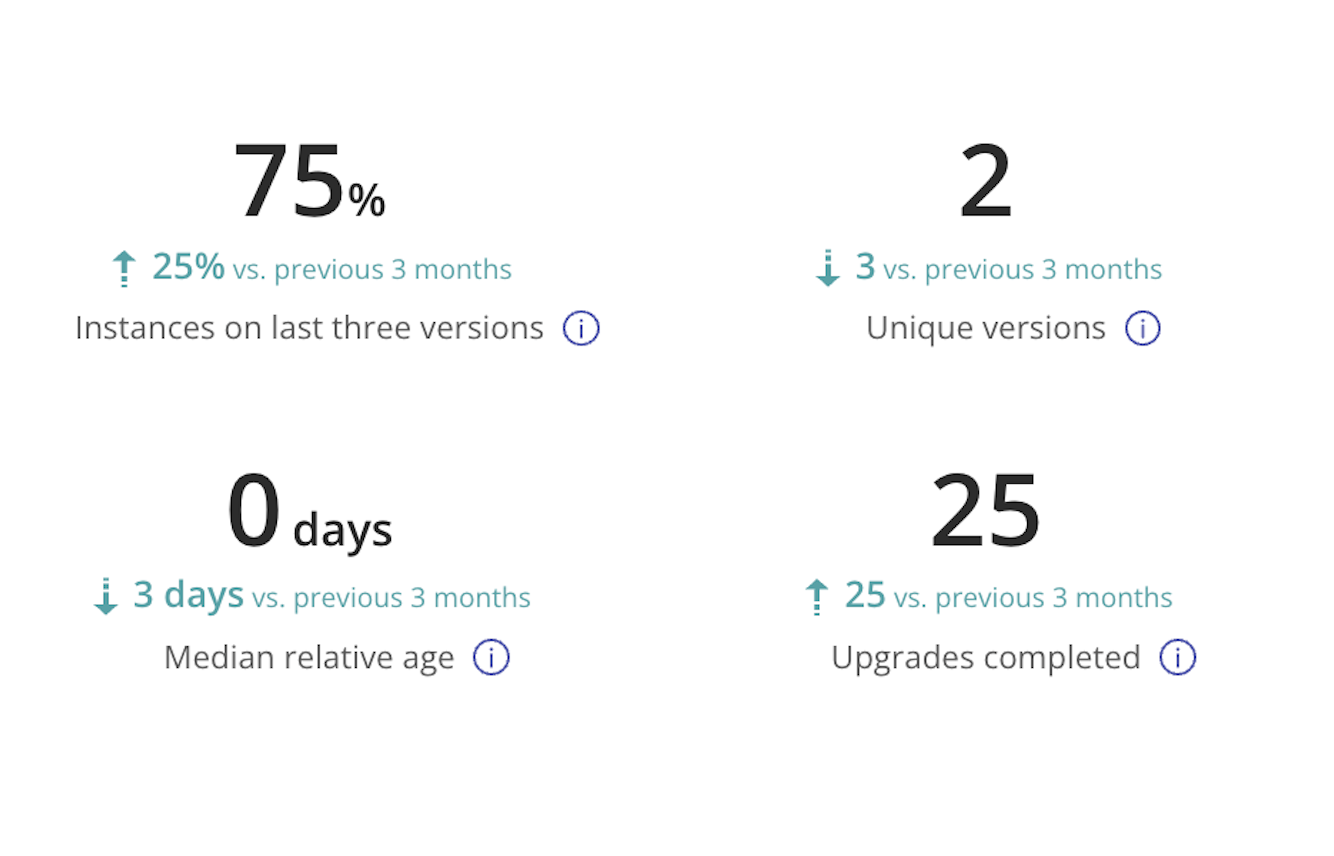
The following shows an example of the metrics in the Adoption section:

View a larger version of this image
As shown in the image above, the Adoption section displays the following metrics:
- Instances on last three versions
- Unique versions
- Median relative age
- Upgrades completed
Based on the time period selected, each metric includes an arrow that shows the change in value compared to the previous period. For example, if the median relative age today is 68 days, the selected time period is three months, and three months ago the median relative age was 55 days, then the metric would show an upward-facing arrow with an increase of 13 days.
The following table describes each metric in the Adoption section, including the formula used to calculate its value and the recommended trend for the metric over time:
| Metric | Description | Target Trend |
|---|---|---|
| Instances on last three versions | Percent of active instances that are running one the latest three versions of your application. Formula: | Increase towards 100% |
| Unique versions | Number of unique versions of your application running in active instances. Formula: | Decrease towards less than or equal to three |
| Median relative age | The relative age of a single instance is the number of days between the date that the instance's version was promoted to the channel and the date when the latest available application version was promoted to the channel. Median relative age is the median value across all active instances for the selected time period and channel. Formula: | Depends on release cadence. For vendors who ship every four to eight weeks, decrease the median relative age towards 60 days or fewer. |
| Upgrades completed | Total number of completed upgrades across active instances for the selected time period and channel. An upgrade is a single version change for an instance. An upgrade is considered complete when the instance deploys the new application version. The instance does not need to become available (as indicated by reaching a Ready state) after deploying the new version for the upgrade to be counted as complete. Formula: | Increase compared to any previous period, unless you reduce your total number of live instances. |