Instance details
This topic describes using the Replicated Vendor Portal to quickly understand the recent events and performance of application instances installed in your customers' environments.
About the instance details page
The Vendor Portal provides insights about the health, status, and performance of the active application instances associated with each customer license on the Instance details page. You can use these insights to more quickly troubleshoot issues with your customers' active instances, helping to reduce support burden.
From the Instance details page, you can also archive and unarchive instances. For more information, see Archive or unarchive an instance in Create and manage customers.
The following shows an example of the Instance details page:
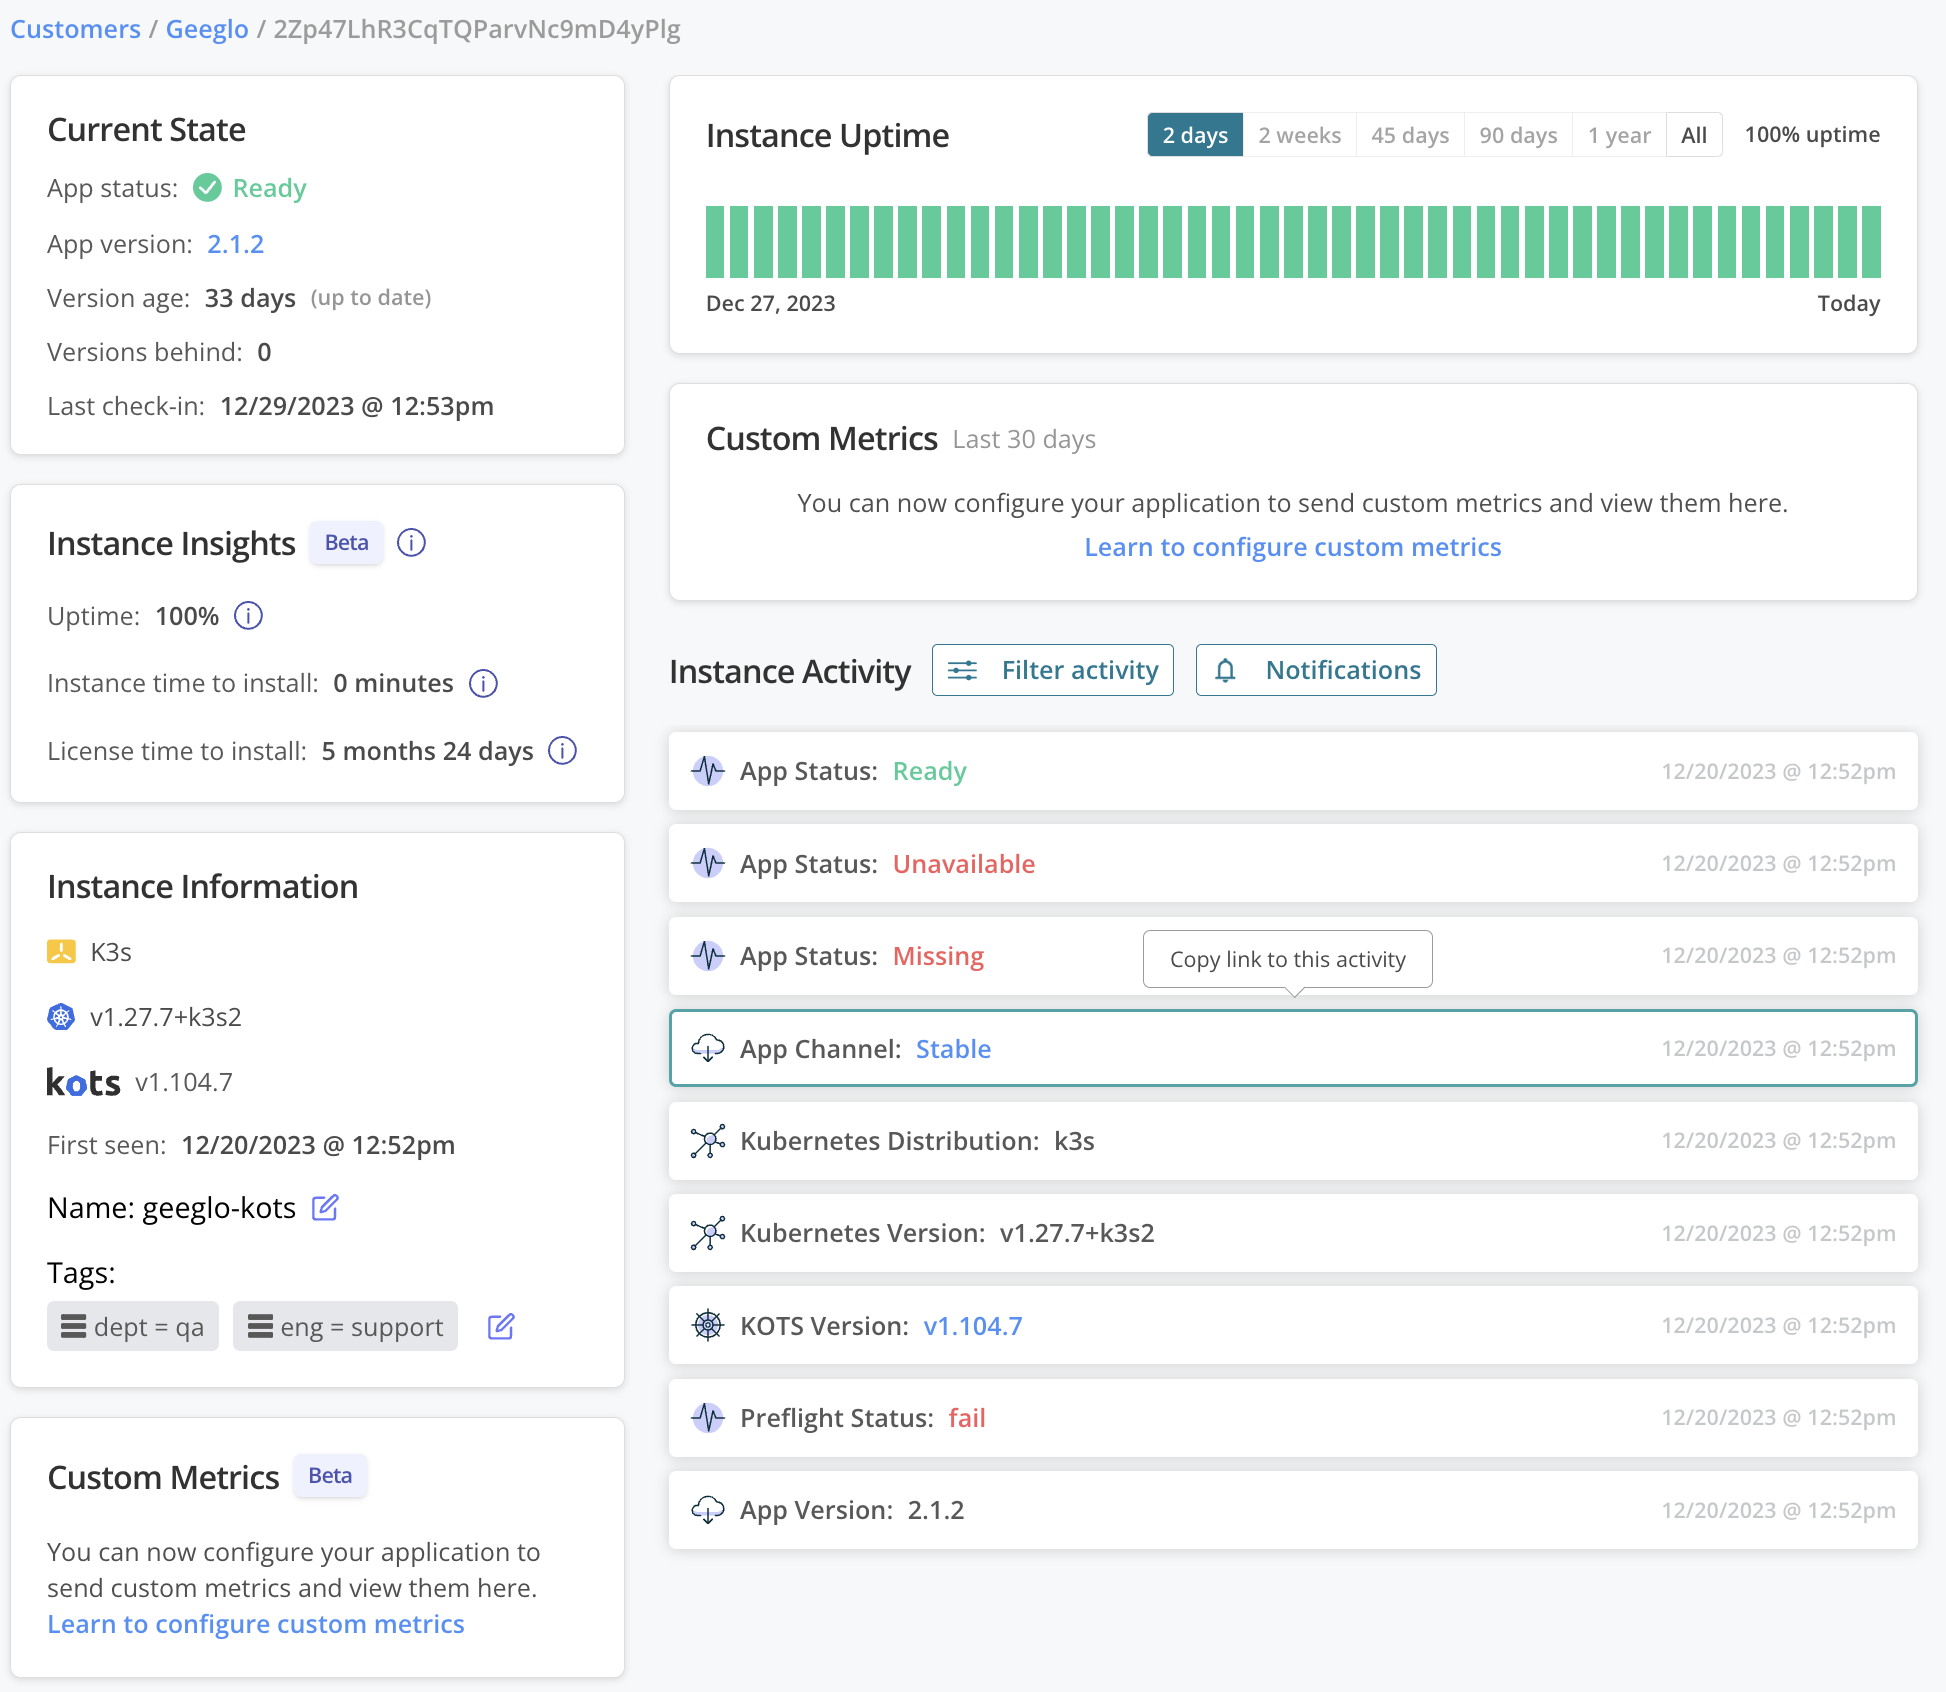
View a larger version of this image
As shown in the image above, the Instance details page includes the following sections:
- Current State: Information about the state of the instance, such as the current application version. See Current State below.
- Instance Insights: Key performance indicators (KPIs) related to health, performance, and adoption. See Insights below.
- Instance Information: Information about the cluster where the instance is installed, such as the version of Kubernetes running on the cluster. See Instance Information below.
- Custom Metrics: The values for any custom metrics that are configured for the application, from the most recent check-in. For more information about configuring custom metrics, see Configure Custom Metrics.
- Instance Uptime: Details about instance uptime over time. See Instance Uptime below.
- Instance Activity: Event data stream. See Instance Activity below.
Current state
The Current State section displays the following event data about the status and version of the instance:
-
App status: The status of the application. Possible statuses are Ready, Updating, Degraded, Unavailable, and Missing. For more information about enabling application status insights and how to interpret the different statuses, see Enabling and Understanding Application Status.
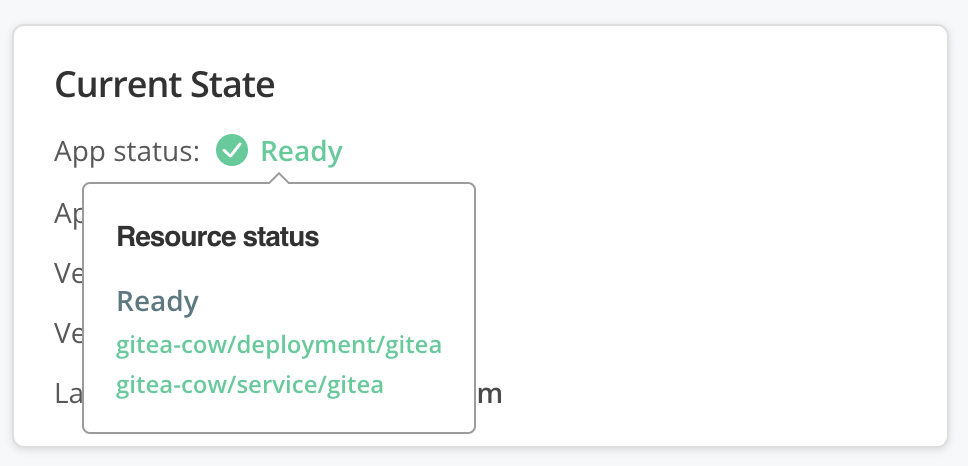
Additionally, for applications that include the Replicated SDK, you can hover over the App status field to view the statuses of the indiviudal resources deployed by the application, as shown in the example below:
-
App version: The version label of the currently running release. You define the version label in the release properties when you promote the release. For more information about defining release properties, see Release Properties in About Channels and Releases.
If there is no version label for the release, then the Vendor Portal displays the release sequence in the App version field. You can find the sequence number associated with a release by running the
replicated release lscommand. See release ls in the Replicated CLI documentation. -
Version age: The absolute and relative ages of the instance:
-
Absolute age:
now - current_release.promoted_dateThe number of days since the currently running application version was promoted to the channel. For example, if the instance is currently running version 1.0.0, and version 1.0.0 was promoted to the channel 30 days ago, then the absolute age is 30.
-
Relative age (Days Behind Latest):
channel.latest_release.promoted_date - current_release.promoted_dateThe number of days between when the currently running application version was promoted to the channel and when the latest available version on the channel was promoted.
For example, the instance is currently running version 1.0.0, which was promoted to the Stable channel. The latest version available on the Stable channel is 1.5.0. If 1.0.0 was promoted 30 days ago and 1.5.0 was promoted 10 days ago, then the relative age of the application instance is 20 days.
-
-
Versions behind: The number of versions between the currently running version and the latest version available on the channel where the instance is assigned.
For example, the instance is currently running version 1.0.0, which was promoted to the Stable channel. If the later versions 1.1.0, 1.2.0, 1.3.0, 1.4.0, and 1.5.0 were also promoted to the Stable channel, then the instance is five versions behind.
-
Last check-in: The timestamp when the instance most recently sent data to the Vendor Portal.
Instance insights
The Insights section includes the following metrics computed by the Vendor Portal:
Uptime
The Vendor Portal computes the total uptime for the instance as the fraction of time that the instance spends with a Ready, Updating, or Degraded status. The Vendor Portal also provides more granular details about uptime in the Instance Uptime graph. See Instance Uptime below.
High uptime indicates that the application is reliable and able to handle the demands of the customer environment. Low uptime might indicate that the application is prone to errors or failures. By measuring the total uptime, you can better understand the performance of your application.
The following table lists the application statuses that are associated with an Up or Down state in the total uptime calculation:
| Uptime State | Application Statuses |
|---|---|
| Up | Ready, Updating, or Degraded |
| Down | Missing or Unavailable |
The Vendor Portal includes time spent in a Degraded status in the total uptime for an instance because an app may still be capable of serving traffic when some subset of desired replicas are available. Further, it is possible that a Degraded state is expected during upgrade.
Time to install
The Vendor Portal computes both License time to install and Instance time to install metrics to represent how quickly the customer was able to deploy the application to a Ready state in their environment.
Replicated recommends that you use Time to Install as an indicator of the quality of the packaging, configuration, and documentation of your application.
If the installation process for your application is challenging, poorly documented, lacks appropriate preflight checks, or relies heavily on manual steps, then it can take days or weeks to deploy the application in customer environments. A longer Time to Install generally represents a significantly increased support burden and a degraded customer installation experience.
The following describes the License time to install and Instance time to install metrics:
-
License time to install: The time between when you create the customer license in the Vendor Portal, and when the application instance reaches a Ready status in the customer environment.
License time to install represents the time that it takes for a customer to successfully deploy your application after you intend to distribute the application to the customer. Replicated uses the timestamp of when you create the customer license in the Vendor Portal to represent your intent to distribute the application because creating the license file is generally the final step before you share the installation materials with the customer.
License time to install includes several activities that are involved in deploying the application, including the customer receiving the necessary materials and documentation, downloading the assets, provisioning the required hardware, networking, external systems, completing the preflight checks, and finally installing, configuring, and deploying the application.
-
Instance time to install: The time between when the Vendor Portal records the first event for the application instance in the customer environment, and when the instance reaches a Ready status.
Instance time to install is the length of time that it takes for the application to reach a Ready state after the customer starts a deployment attempt in their environment. Replicated considers a deployment attempt started when the Vendor Portal first records an event for the instance.
For more information about how the Vendor Portal generates events, see About Events in Event Data.
noteInstance time to install does not include any deployment attempts that a customer might have made that did not generate an event. For example, time spent by the customer discarding the server used in a failed attempt before attempting to deploy the instance again on a new server.
Instance information
The Instance Information section displays the following details about the cluster infrastructure where the application is installed as well as vendor-defined metadata about the instance:
- The Kubernetes distribution for the cluster. For example, GKE or EKS.
- The version of Kubernetes running in the cluster.
- The version of KOTS or the Replicated SDK installed in the cluster.
- For First Seen, the timestamp of the first event that the Vendor Portal generated for the instance. For more information about how the Vendor Portal generates events, see About Events in Event Data.
- If detected, the cloud provider and region where the cluster is running. For example,
GCP: us-central1. - An optional vendor-defined name for the instance.
- Optional vendor-defined instance tags in the form of key-value pairs. Each instance can have a maximum of 10 tags.
In addition to the details listed above, the Instance Information section also displays the following for embedded clusters provisioned by Replicated kURL:
- Node operating systems
- Node operating systems versions
- Total number of cluster nodes
- Number of cluster nodes in a Ready state
- ID of the kURL installer specification
Instance uptime
The Instance Uptime graph shows the percentage of a given time period that the instance was in an Up, Degraded, or Down state.
To determine if the instance is Up, Degraded, or Down, the Vendor Portal uses the application status. Possible application statuses are Ready, Updating, Degraded, Unavailable, and Missing. The following table lists the application statuses that are associated with each state in the Instance Uptime graph:
| Uptime State | Application Statuses |
|---|---|
| Up | Ready or Updating |
| Degraded | Degraded |
| Down | Missing or Unavailable |
The following shows an example of an Instance Uptime graph:
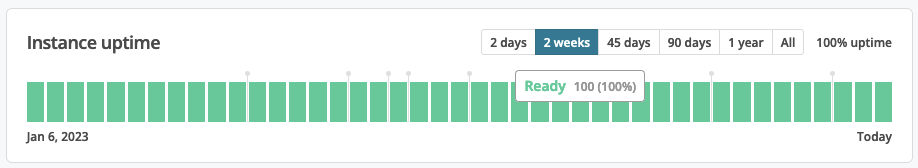
You can hover over the bars in the Instance Uptime graph to view more detail about the percent of time that the instance was in each state during the given time period.
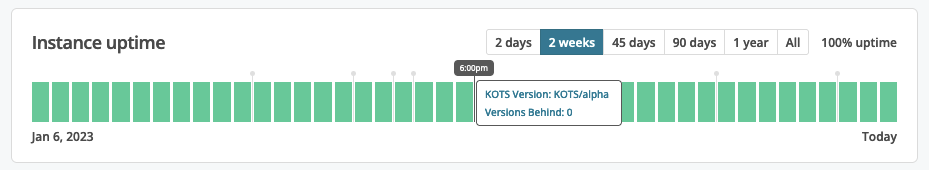
You can hover over the event markers in the Instance Uptime graph to view more detail about the events that occurred during that given interval on the graph. If more than two events occurred in that period, the event marker displays the number of events that occurred during that period. If you click the event marker or the event in the tooltip, the Instance Activity section highlights the event or the first event in the group.
Instance activity
The Instance Activity section displays recent events for the instance. The data stream is updated each time an instance check-in occurs. For more information about what triggers an instance check-in, see How the Vendor Portal Collects Instance Data in About Instance and Event Data.
The timestamp of events displayed in the Instance Activity stream is the timestamp when the Replicated Vendor API received data from the instance. The timestamp of events does not necessarily reflect the timestamp of when the event occurred.
The following shows an example of the Instance Activity data stream:
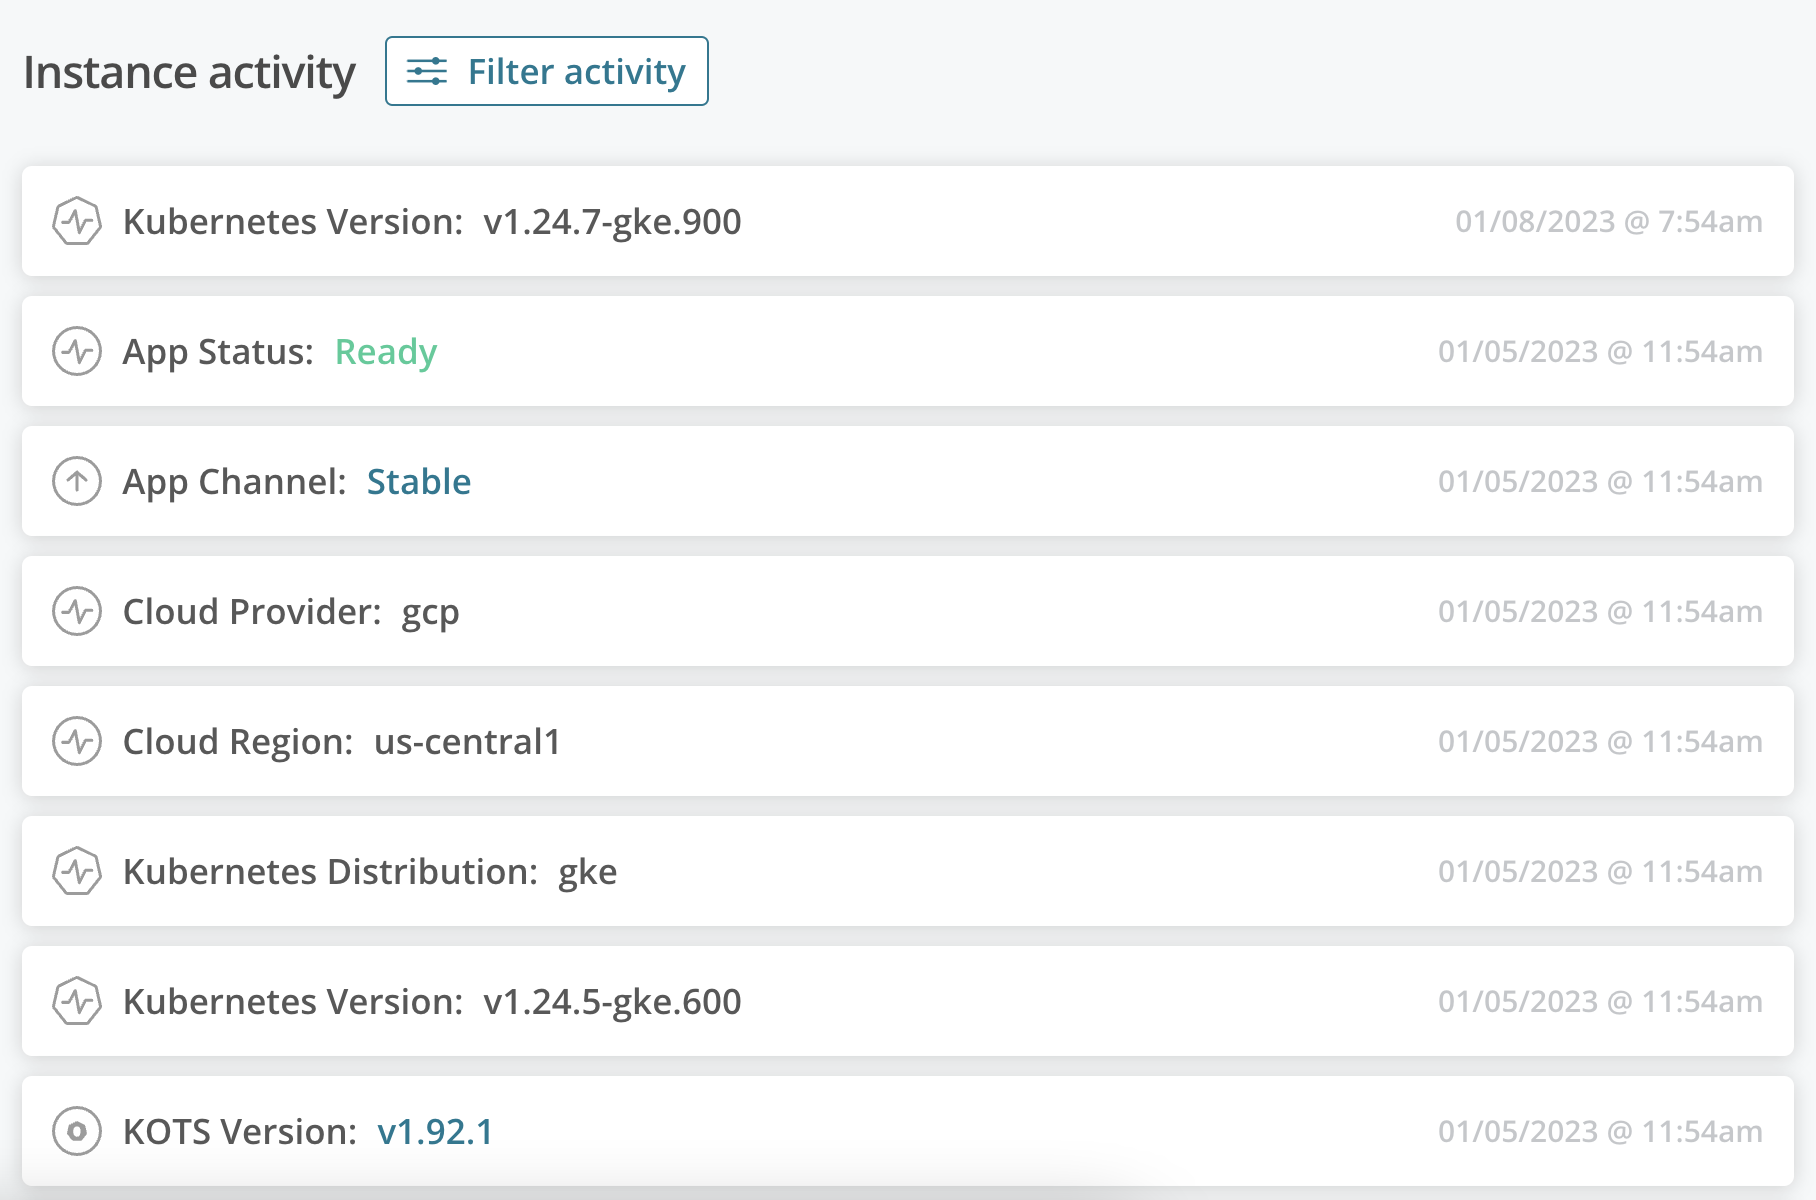
You can filter the Instance Activity stream by the following categories:
- App install/upgrade
- App status
- Cluster status
- Custom metrics
- Infrastructure status
- KOTS version
- Replicated SDK version
- Upstream update
The following tables describe the events that can be displayed in the Instance Activity stream for each of the categories above:
App install/upgrade
| Label | Description |
|---|---|
| App Channel | The ID of the channel the application instance is assigned. |
| App Version | The version label of the release that the instance is currently running. The version label is the version that you assigned to the release when promoting it to a channel. |
App status
| Label | Description |
|---|---|
| App Status | A string that represents the status of the application. Possible values: Ready, Updating, Degraded, Unavailable, Missing. For applications that include the Replicated SDK, hover over the application status to view the statuses of the indiviudal resources deployed by the application. For more information, see Enabling and Understanding Application Status. |
Cluster status
| Label | Description |
|---|---|
| Cluster Type | Indicates if the cluster was provisioned by kURL. Possible values:
For more information about kURL clusters, see Creating a kURL installer. |
| Kubernetes Version | The version of Kubernetes running in the cluster. |
| Kubernetes Distribution | The Kubernetes distribution of the cluster. Possible values:
|
| kURL Nodes Total | Total number of nodes in the cluster. Note: Applies only to kURL clusters. |
| kURL Nodes Ready | Number of nodes in the cluster that are in a healthy state and ready to run Pods. Note: Applies only to kURL clusters. |
| New kURL Installer | The ID of the kURL installer specification that kURL used to provision the cluster. Indicates that a new Installer specification was added. An installer specification is a manifest file that has For more information about installer specifications for kURL, see Creating a kURL installer. Note: Applies only to kURL clusters. |
Custom metrics
You can filter the activity feed by any custom metrics that are configured for the application. The labels for the custom metrics vary depending on the custom key value pairs included in the data set that is sent to the Vendor Portal. For example, the key value pair "num_projects": 5 is displayed as Num Projects: 5 in the activity feed.
For more information about configuring custom metrics, see Configure Custom Metrics.
Infrastructure status
| Label | Description |
|---|---|
| Cloud Provider | The cloud provider where the instance is running. Cloud provider is determined by the IP address that makes the request. Possible values:
|
| Cloud Region | The cloud provider region where the instance is running. For example, |
KOTS version
| Label | Description |
|---|---|
| KOTS Version | The version of KOTS that the instance is running. KOTS version is displayed as a Semantic Versioning compliant string. |
Replicated SDK version
| Label | Description |
|---|---|
| Replicated SDK Version | The version of the Replicated SDK that the instance is running. SDK version is displayed as a Semantic Versioning compliant string. |
Upstream update
| Label | Description |
|---|---|
| Versions Behind | The number of versions between the version that the instance is currently running and the latest version available on the channel. Computed by the Vendor Portal each time it receives instance data. |