Step 6: Install the Release with KOTS
Next, get the KOTS installation command from the Unstable channel in the Vendor Portal and then install the release using the customer license that you downloaded.
As part of installation, you will set Grafana login credentials on the KOTS Admin Console configuration page.
To install the release with KOTS:
-
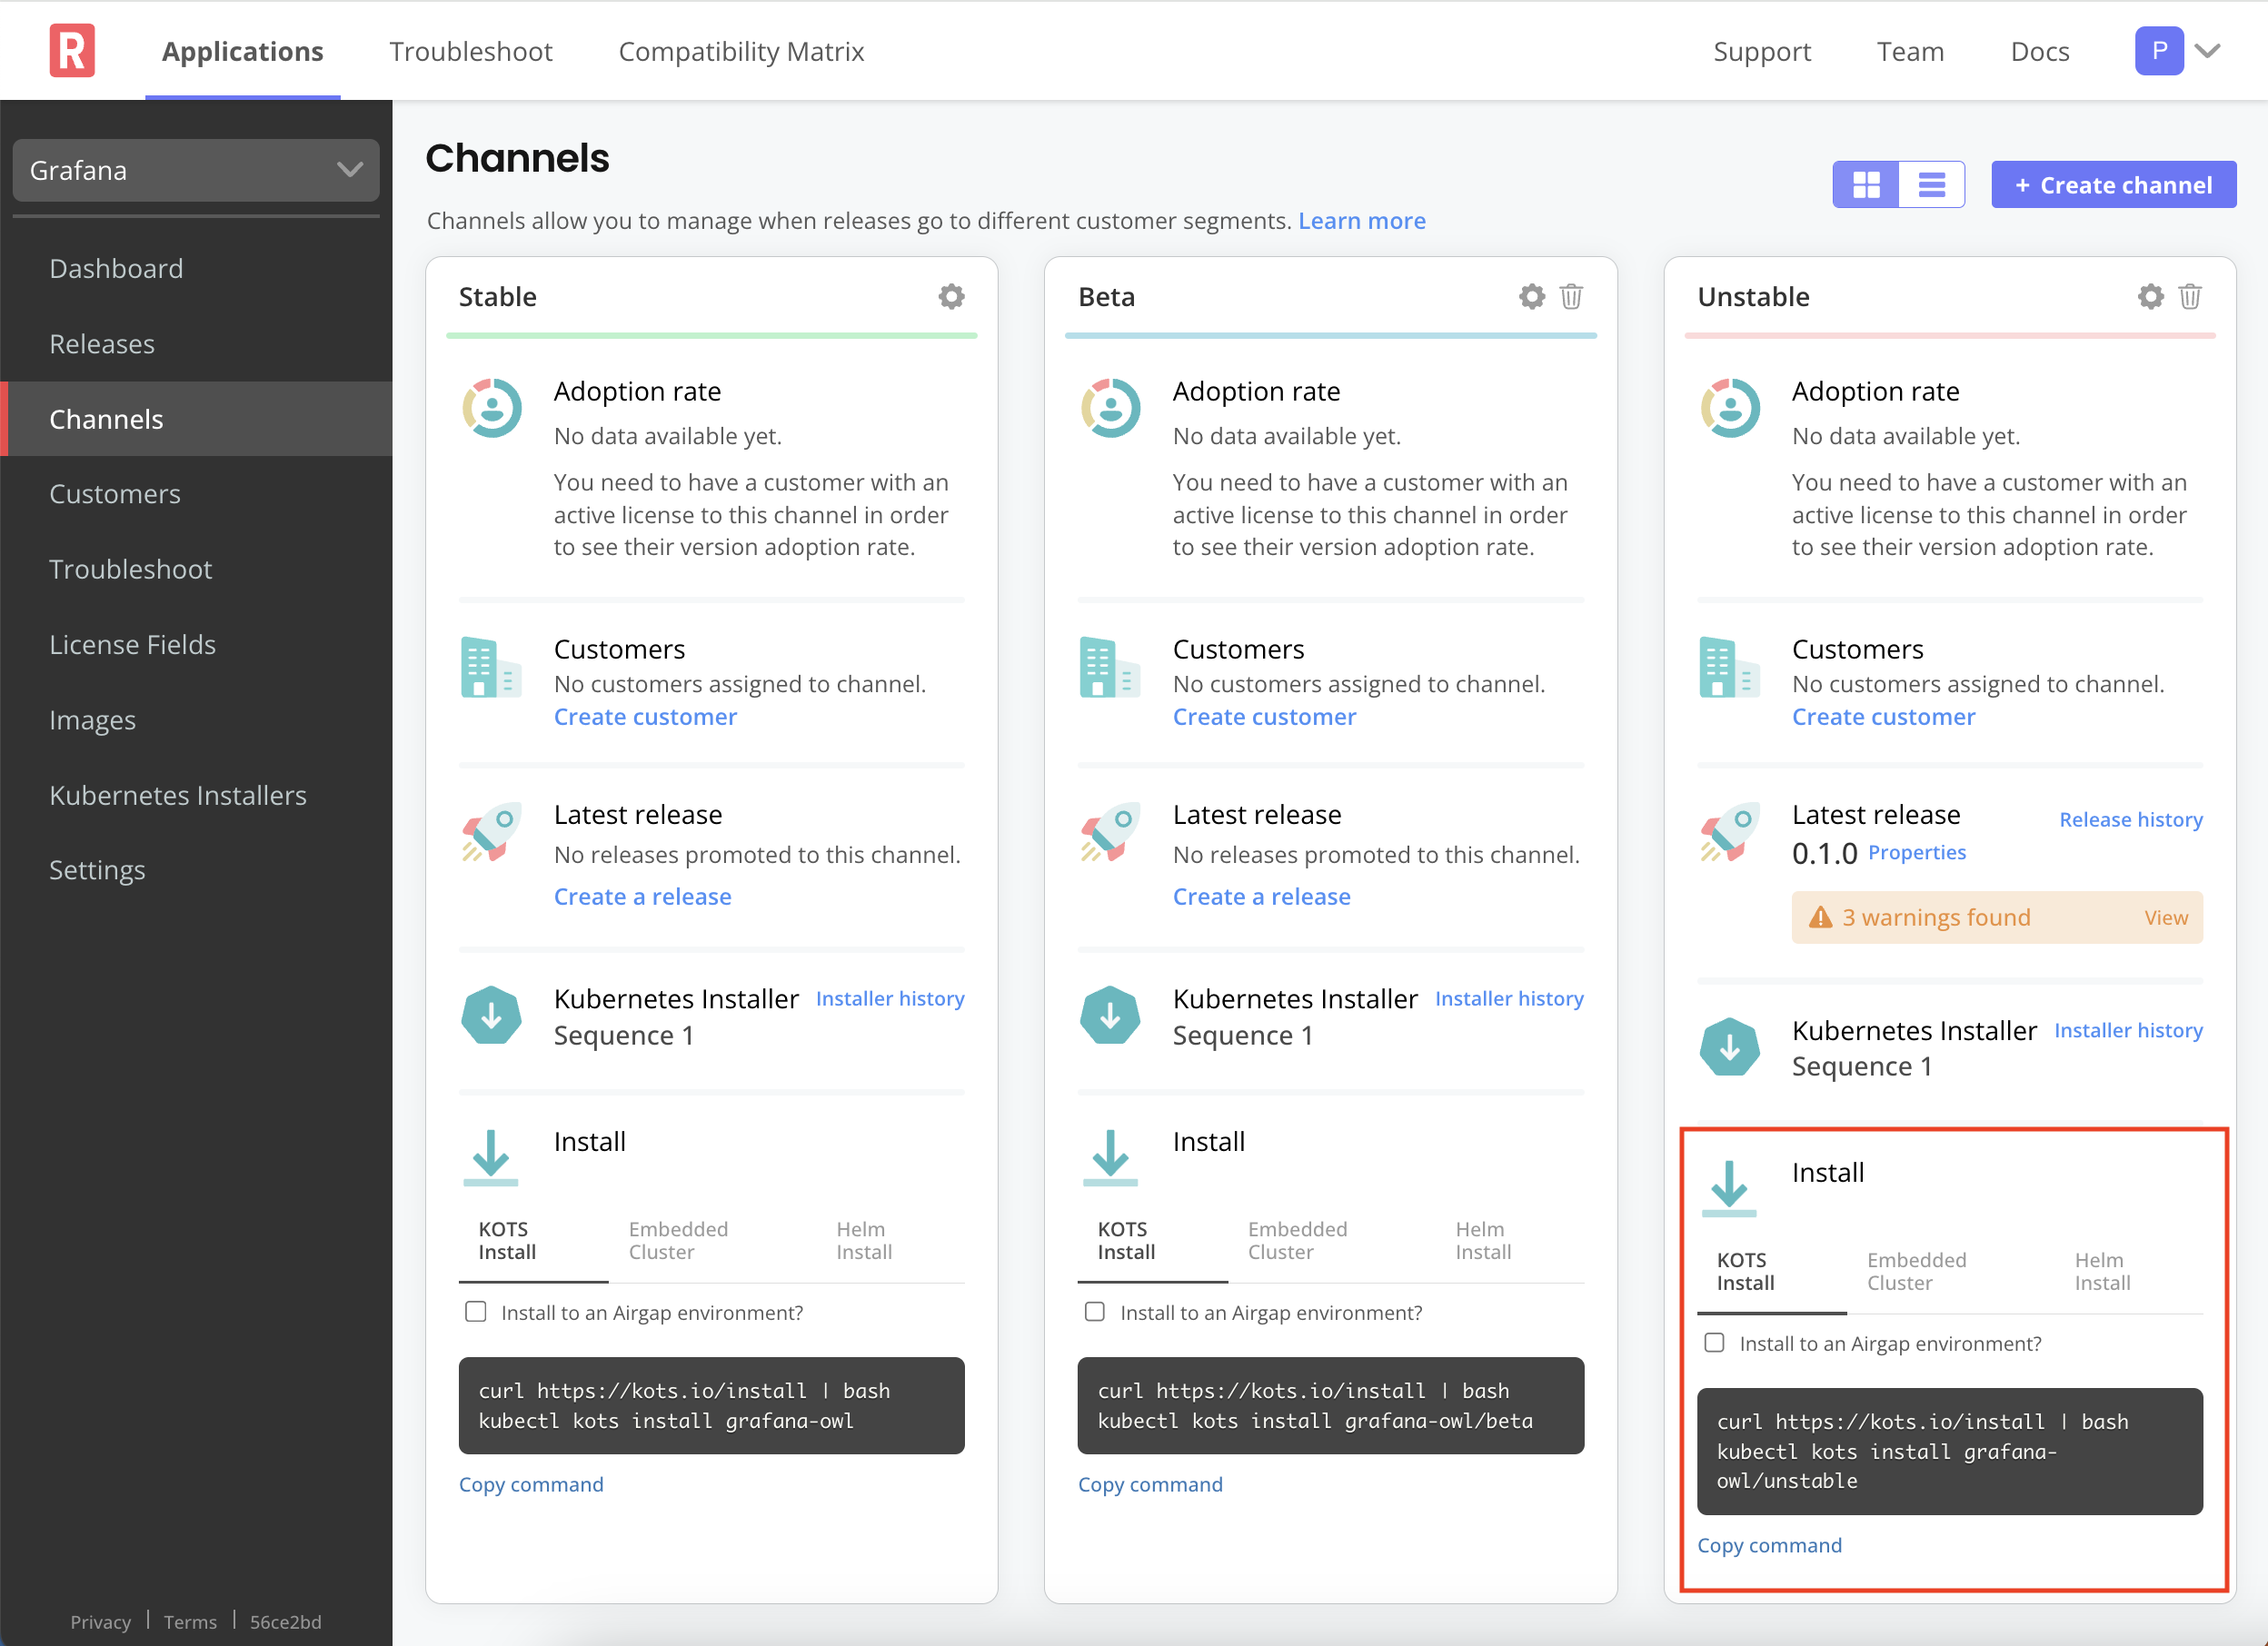
In the Vendor Portal, go to Channels. From the Unstable channel card, under Install, copy the KOTS Install command.
-
On the command line, run the KOTS Install command that you copied:
curl https://kots.io/install | bash
kubectl kots install $REPLICATED_APP/unstable
This installs the latest version of the KOTS CLI and the Admin Console. The Admin Console provides a user interface where you can upload the customer license file and deploy the application.
For additional KOTS CLI installation options, including how to install without root access, see Installing the KOTS CLI.
noteKOTS v1.104.0 or later is required to deploy the Replicated SDK. You can verify the version of KOTS installed with
kubectl kots version. -
Complete the installation command prompts:
-
For
Enter the namespace to deploy to, entergrafana. -
For
Enter a new password to be used for the Admin Console, provide a password to access the Admin Console.
When the Admin Console is ready, the command prints the URL where you can access the Admin Console. At this point, the KOTS CLI is installed and the Admin Console is running, but the application is not yet deployed.
Example output:
Enter the namespace to deploy to: grafana
• Deploying Admin Console
  • Creating namespace ✓
  • Waiting for datastore to be ready ✓
Enter a new password for the Admin Console (6+ characters): ••••••••
• Waiting for Admin Console to be ready ✓

• Press Ctrl+C to exit
• Go to http://localhost:8800 to access the Admin Console -
-
With the port forward running, go to
http://localhost:8800in a browser to access the Admin Console. -
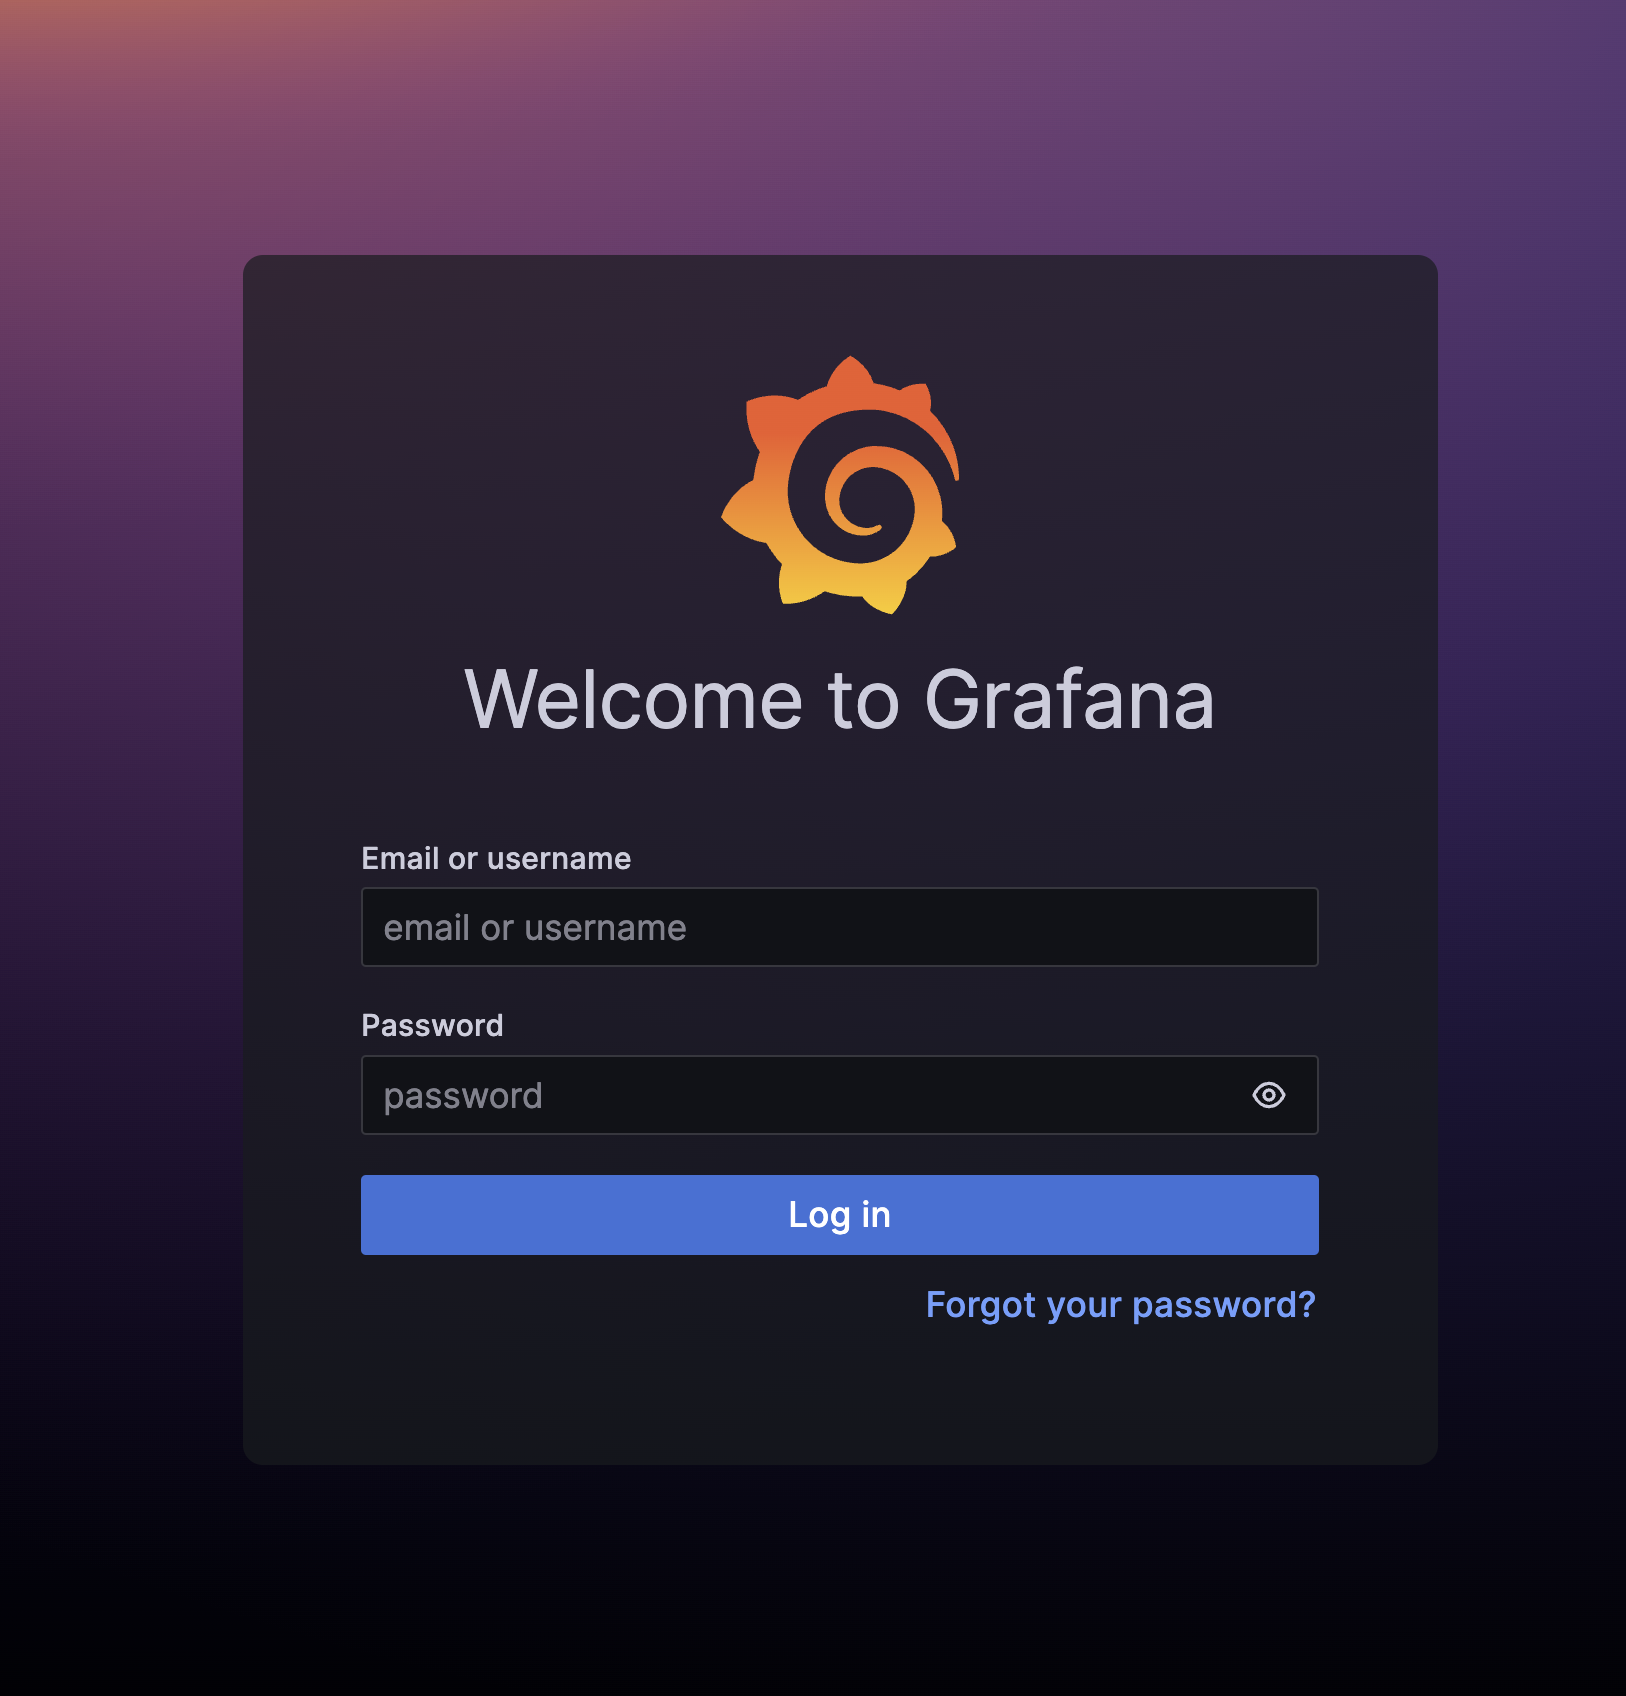
On the login page, enter the password that you created for the Admin Console.
-
On the license page, select the license file that you downloaded previously and click Upload license.
-
On the Configure Grafana page, enter a username and password. You will use these credentials to log in to Grafana.
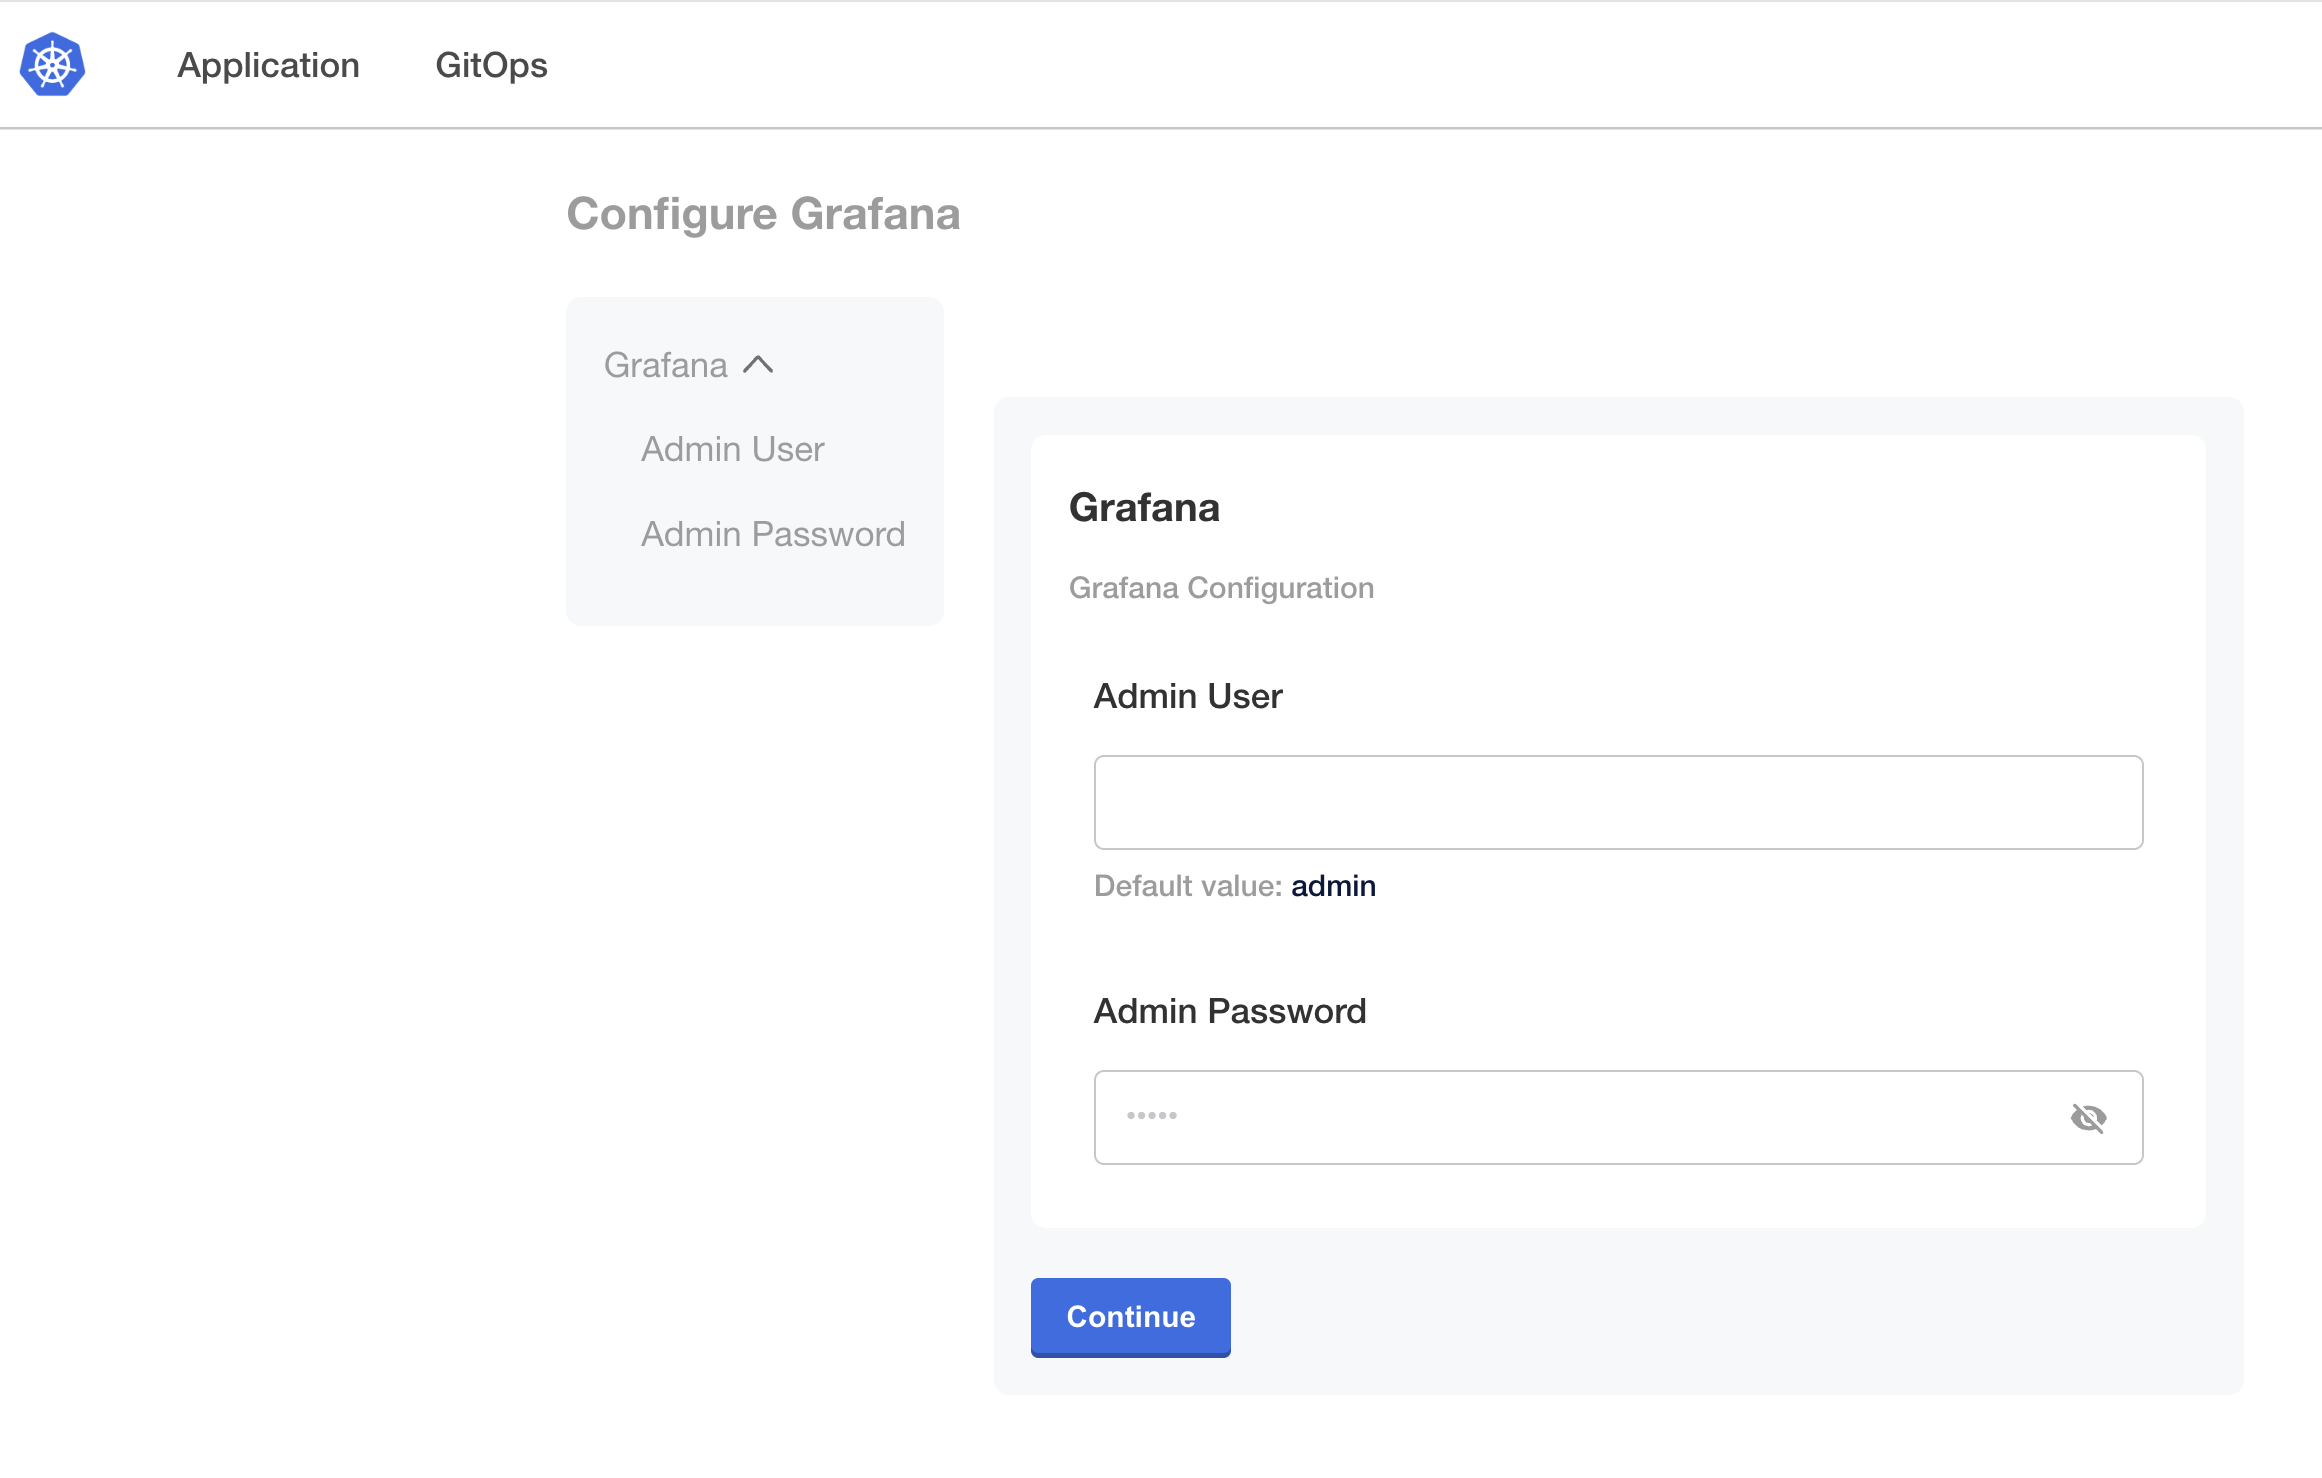
-
Click Continue.
The Admin Console dashboard opens. The application status changes from Missing to Unavailable while the
grafanaDeployment is being created.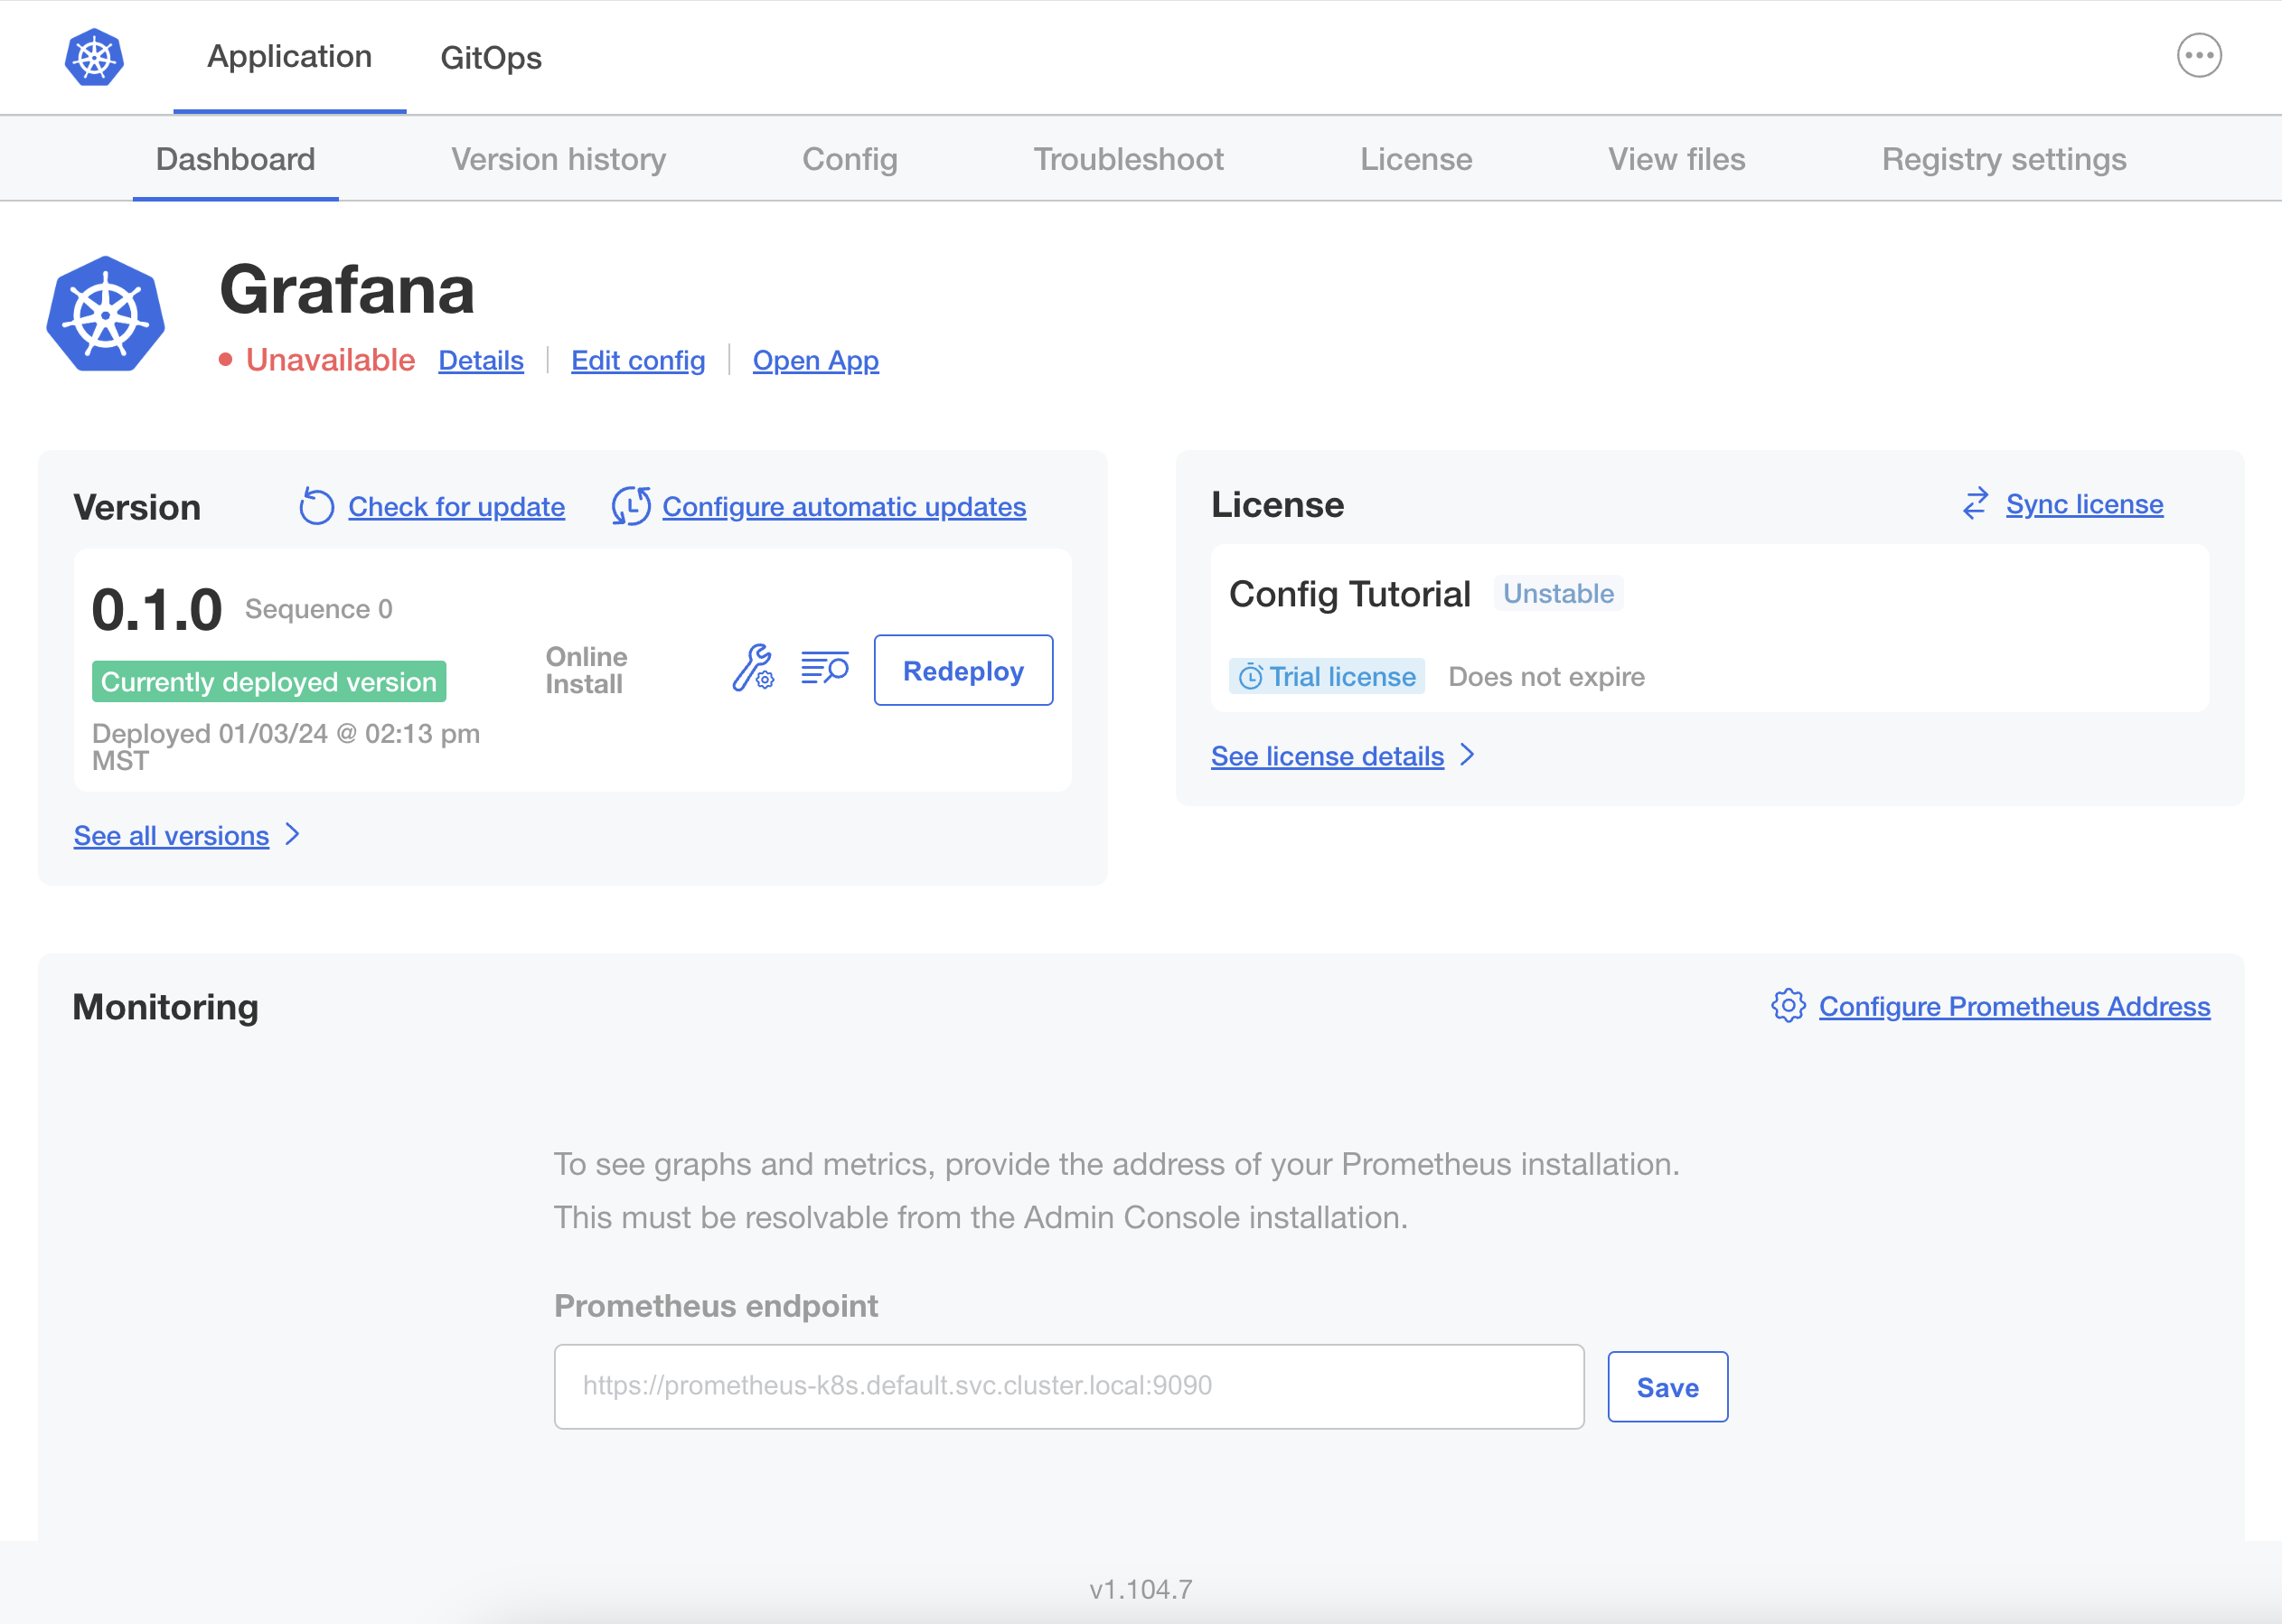
-
On the command line, press Ctrl+C to exit the port forward.
-
Watch for the
grafanaDeployment to become ready:kubectl get deploy grafana --namespace grafana --watch -
After the Deployment is ready, run the following command to confirm that the
grafana-adminSecret was updated with the new password that you created on the Configure Grafana page:echo "Password: $(kubectl get secret grafana-admin --namespace grafana -o jsonpath="{.data.GF_SECURITY_ADMIN_PASSWORD}" | base64 -d)"The ouput of this command displays the password that you created.
-
Start the port foward again to access the Admin Console:
kubectl kots admin-console --namespace grafana -
Go to
http://localhost:8800to open the Admin Console.On the Admin Console dashboard, the application status is now displayed as Ready:
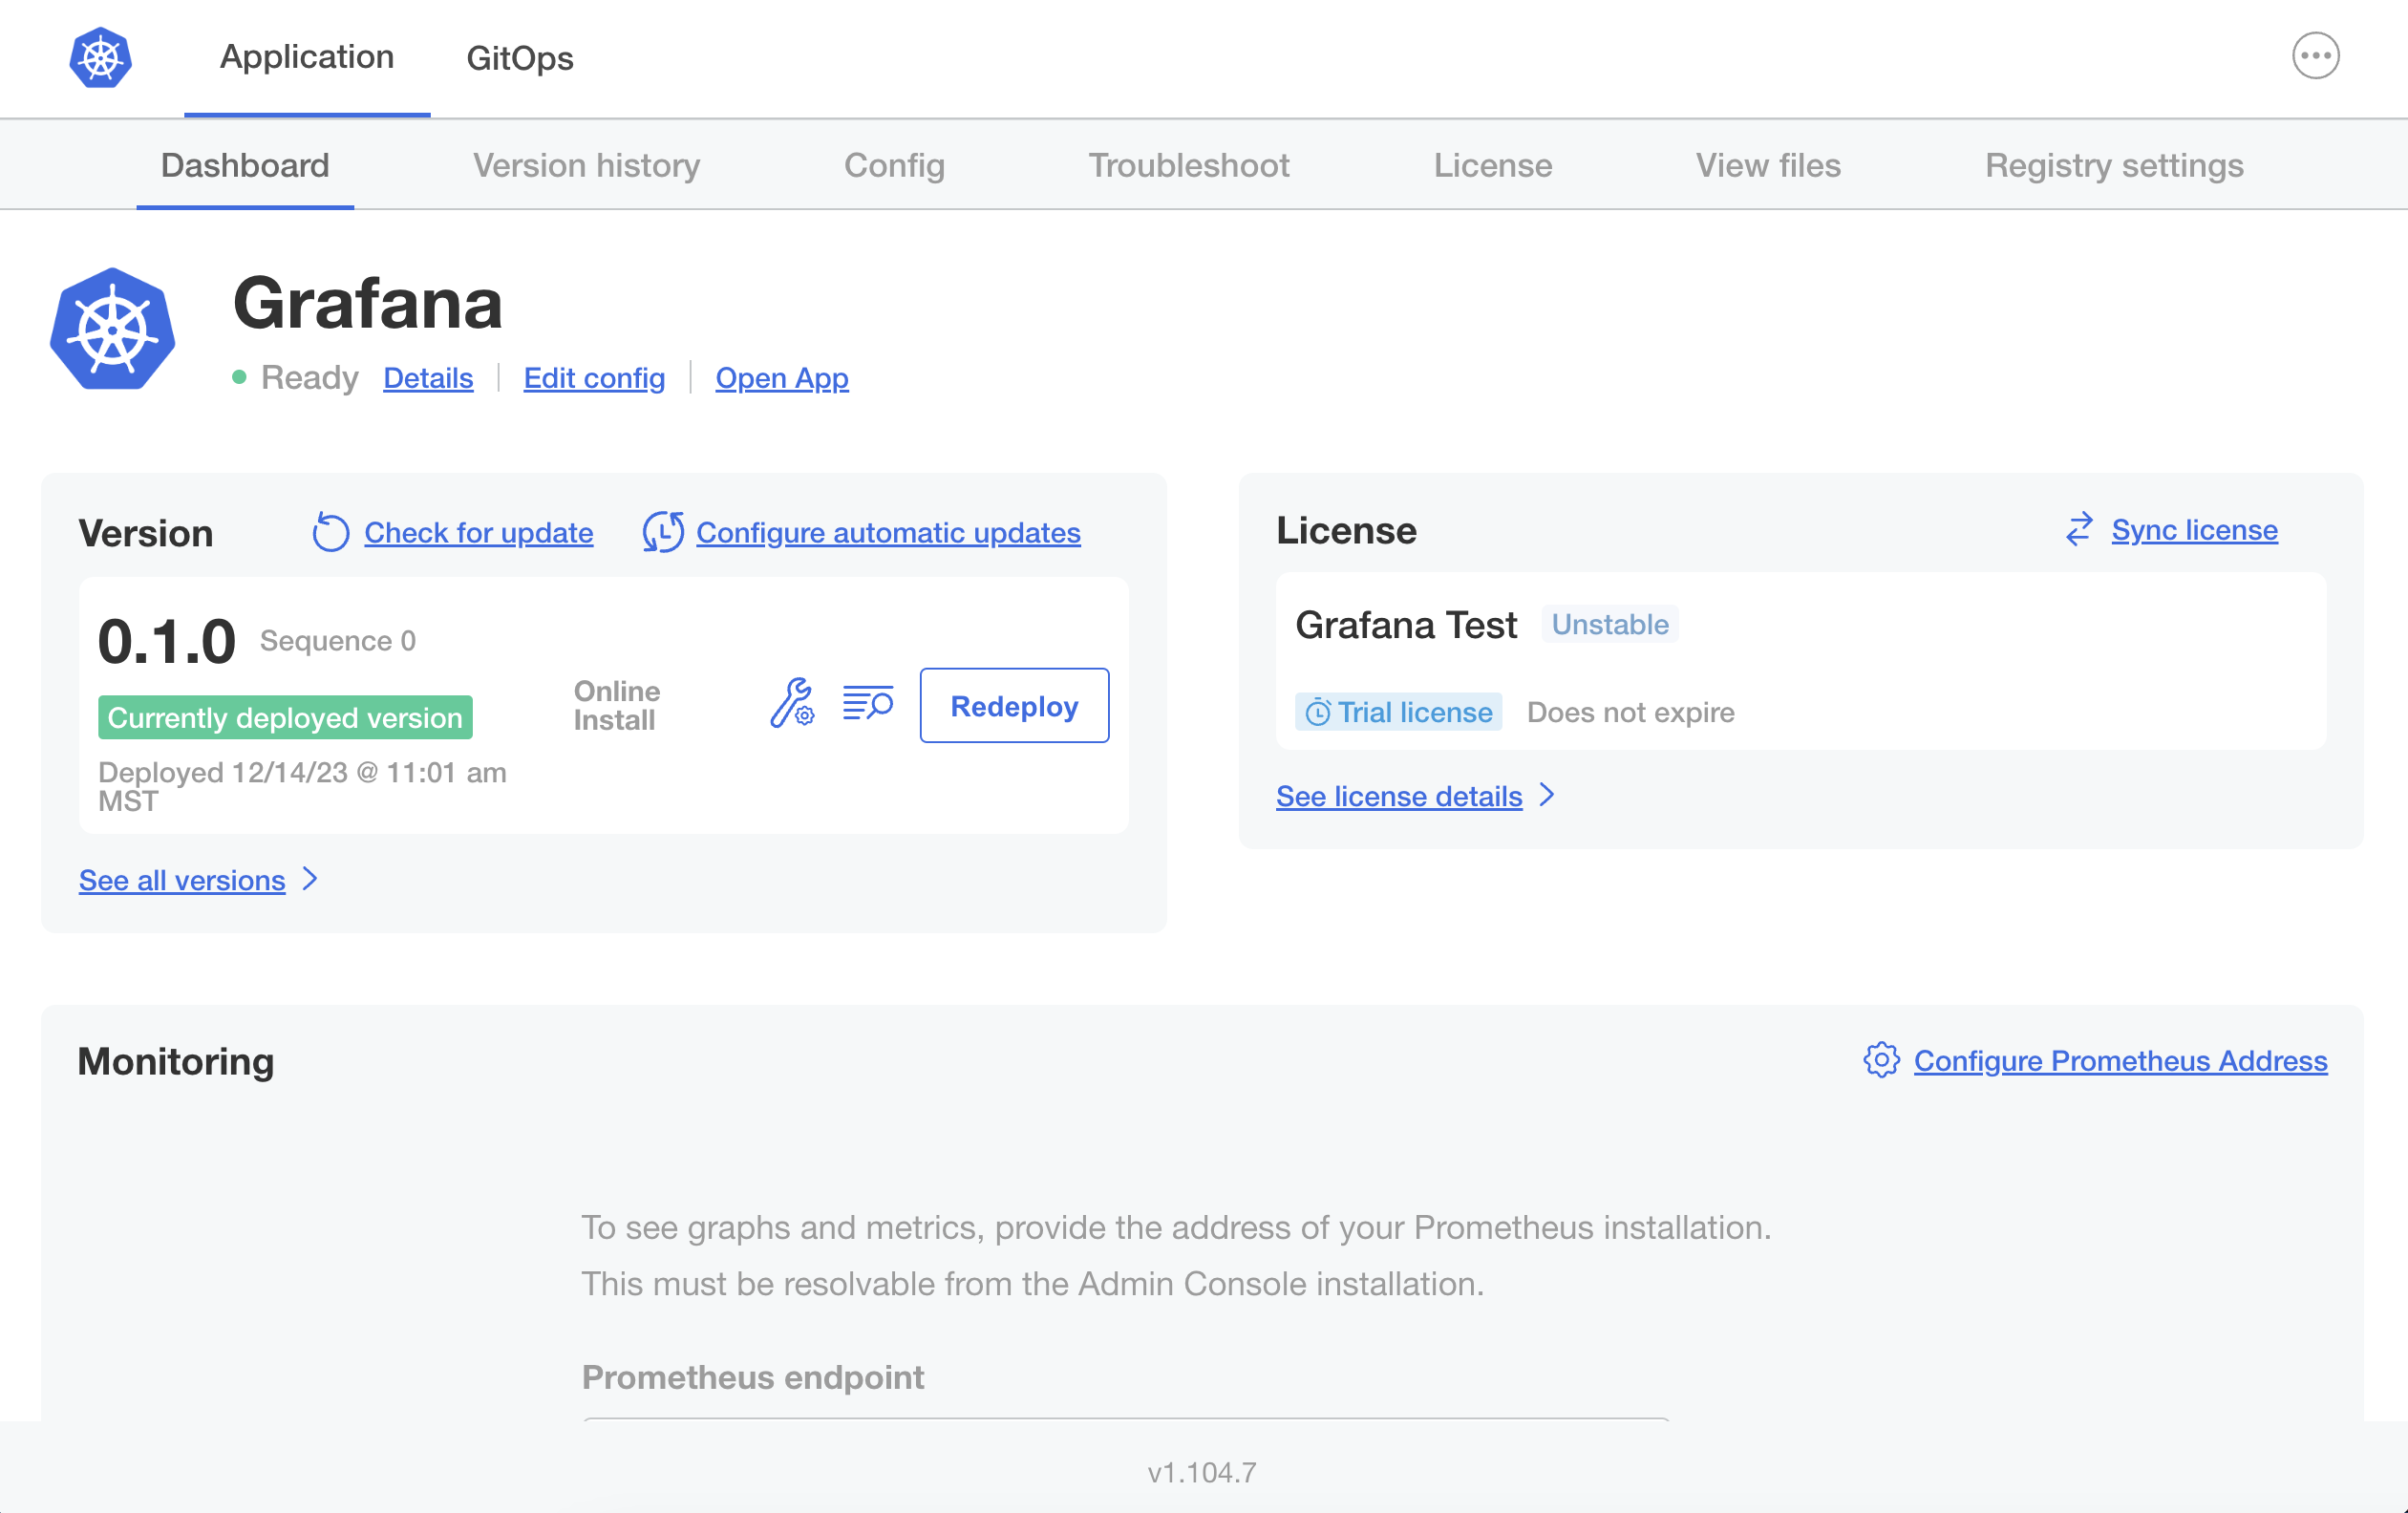
-
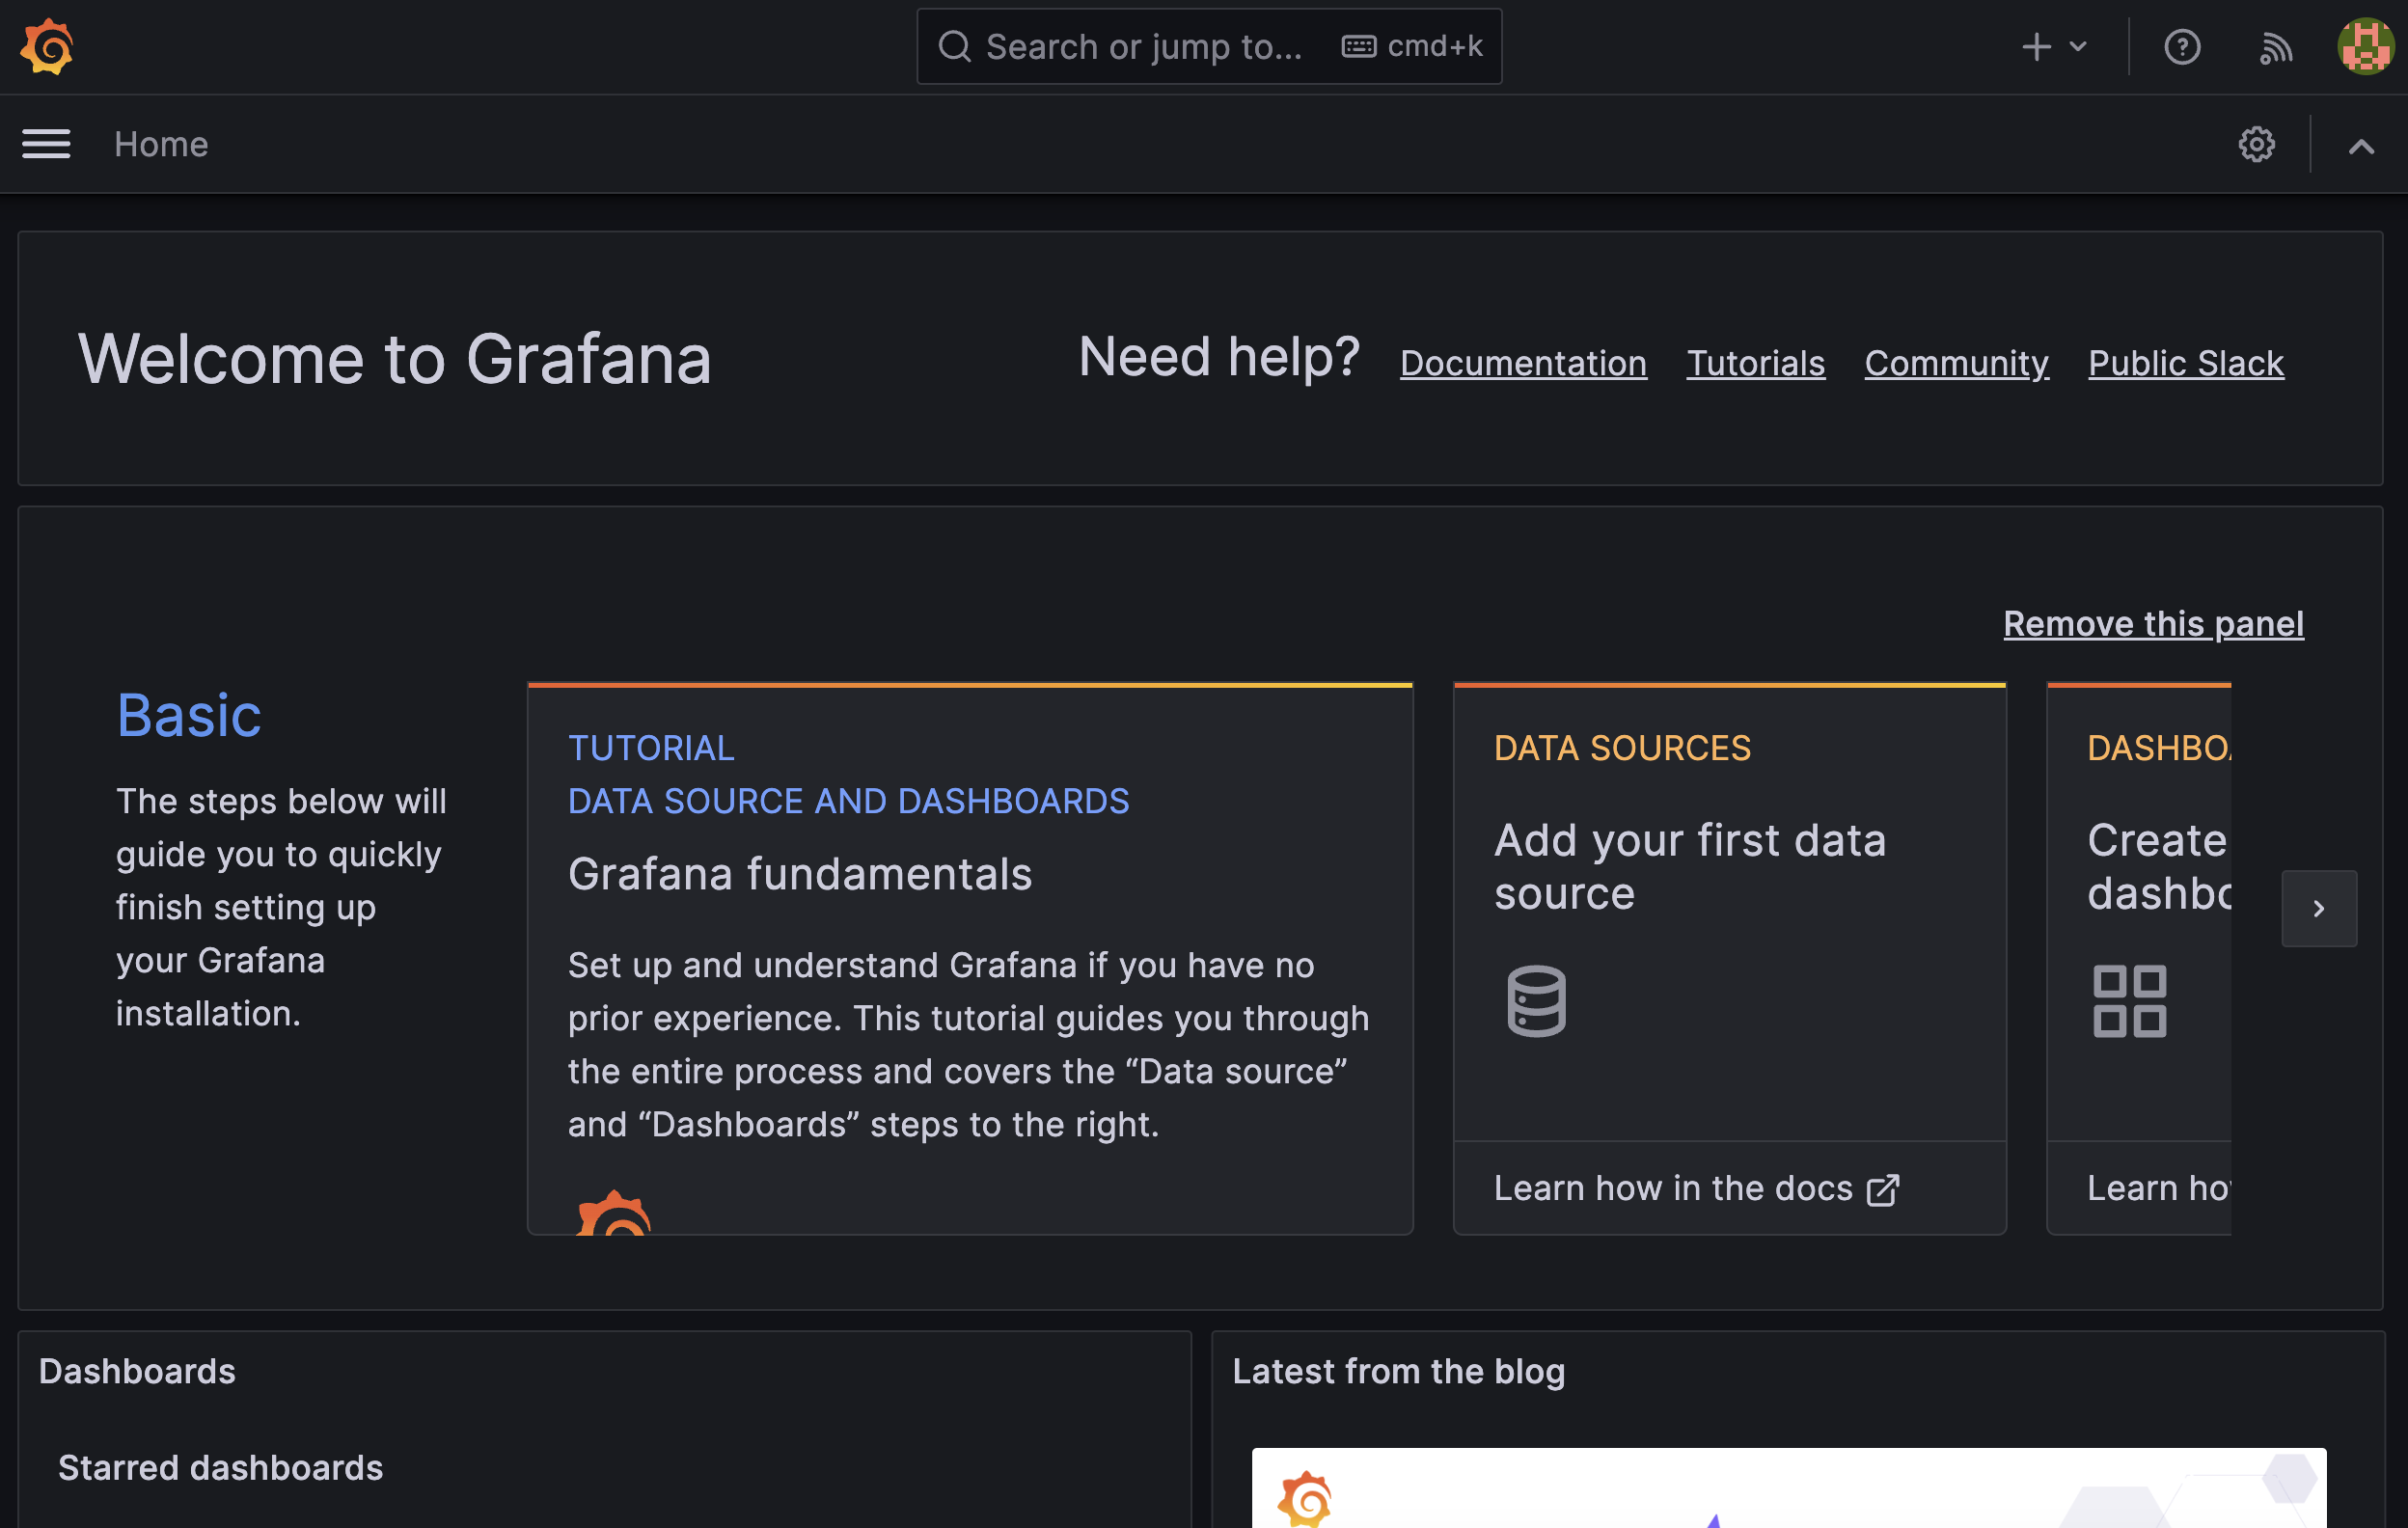
Click Open App to open the Grafana login page in a browser.
-
On the Grafana login page, enter the username and password that you created on the Configure Grafana page. Confirm that you can log in to the application to access the Grafana dashboard:
-
On the command line, press Ctrl+C to exit the port forward.
-
Uninstall the Grafana application from your cluster:
kubectl kots remove $REPLICATED_APP --namespace grafana --undeployExample output:
 • Removing application grafana-python reference from Admin Console and deleting associated resources from the cluster ✓
• Application grafana-python has been removed -
Remove the Admin Console from the cluster:
-
Delete the namespace where the Admin Console is installed:
kubectl delete namespace grafana -
Delete the Admin Console ClusterRole and ClusterRoleBinding:
kubectl delete clusterrole kotsadm-rolekubectl delete clusterrolebinding kotsadm-rolebinding
-
Next Step
Congratulations! As part of this tutorial, you used the KOTS Config custom resource to define a configuration page in the Admin Console. You also used the KOTS HelmChart custom resource and KOTS ConfigOption template function to override the default Grafana login credentials with a user-supplied username and password.
To learn more about how to customize the Config custom resource to create configuration fields for your application, see Config.